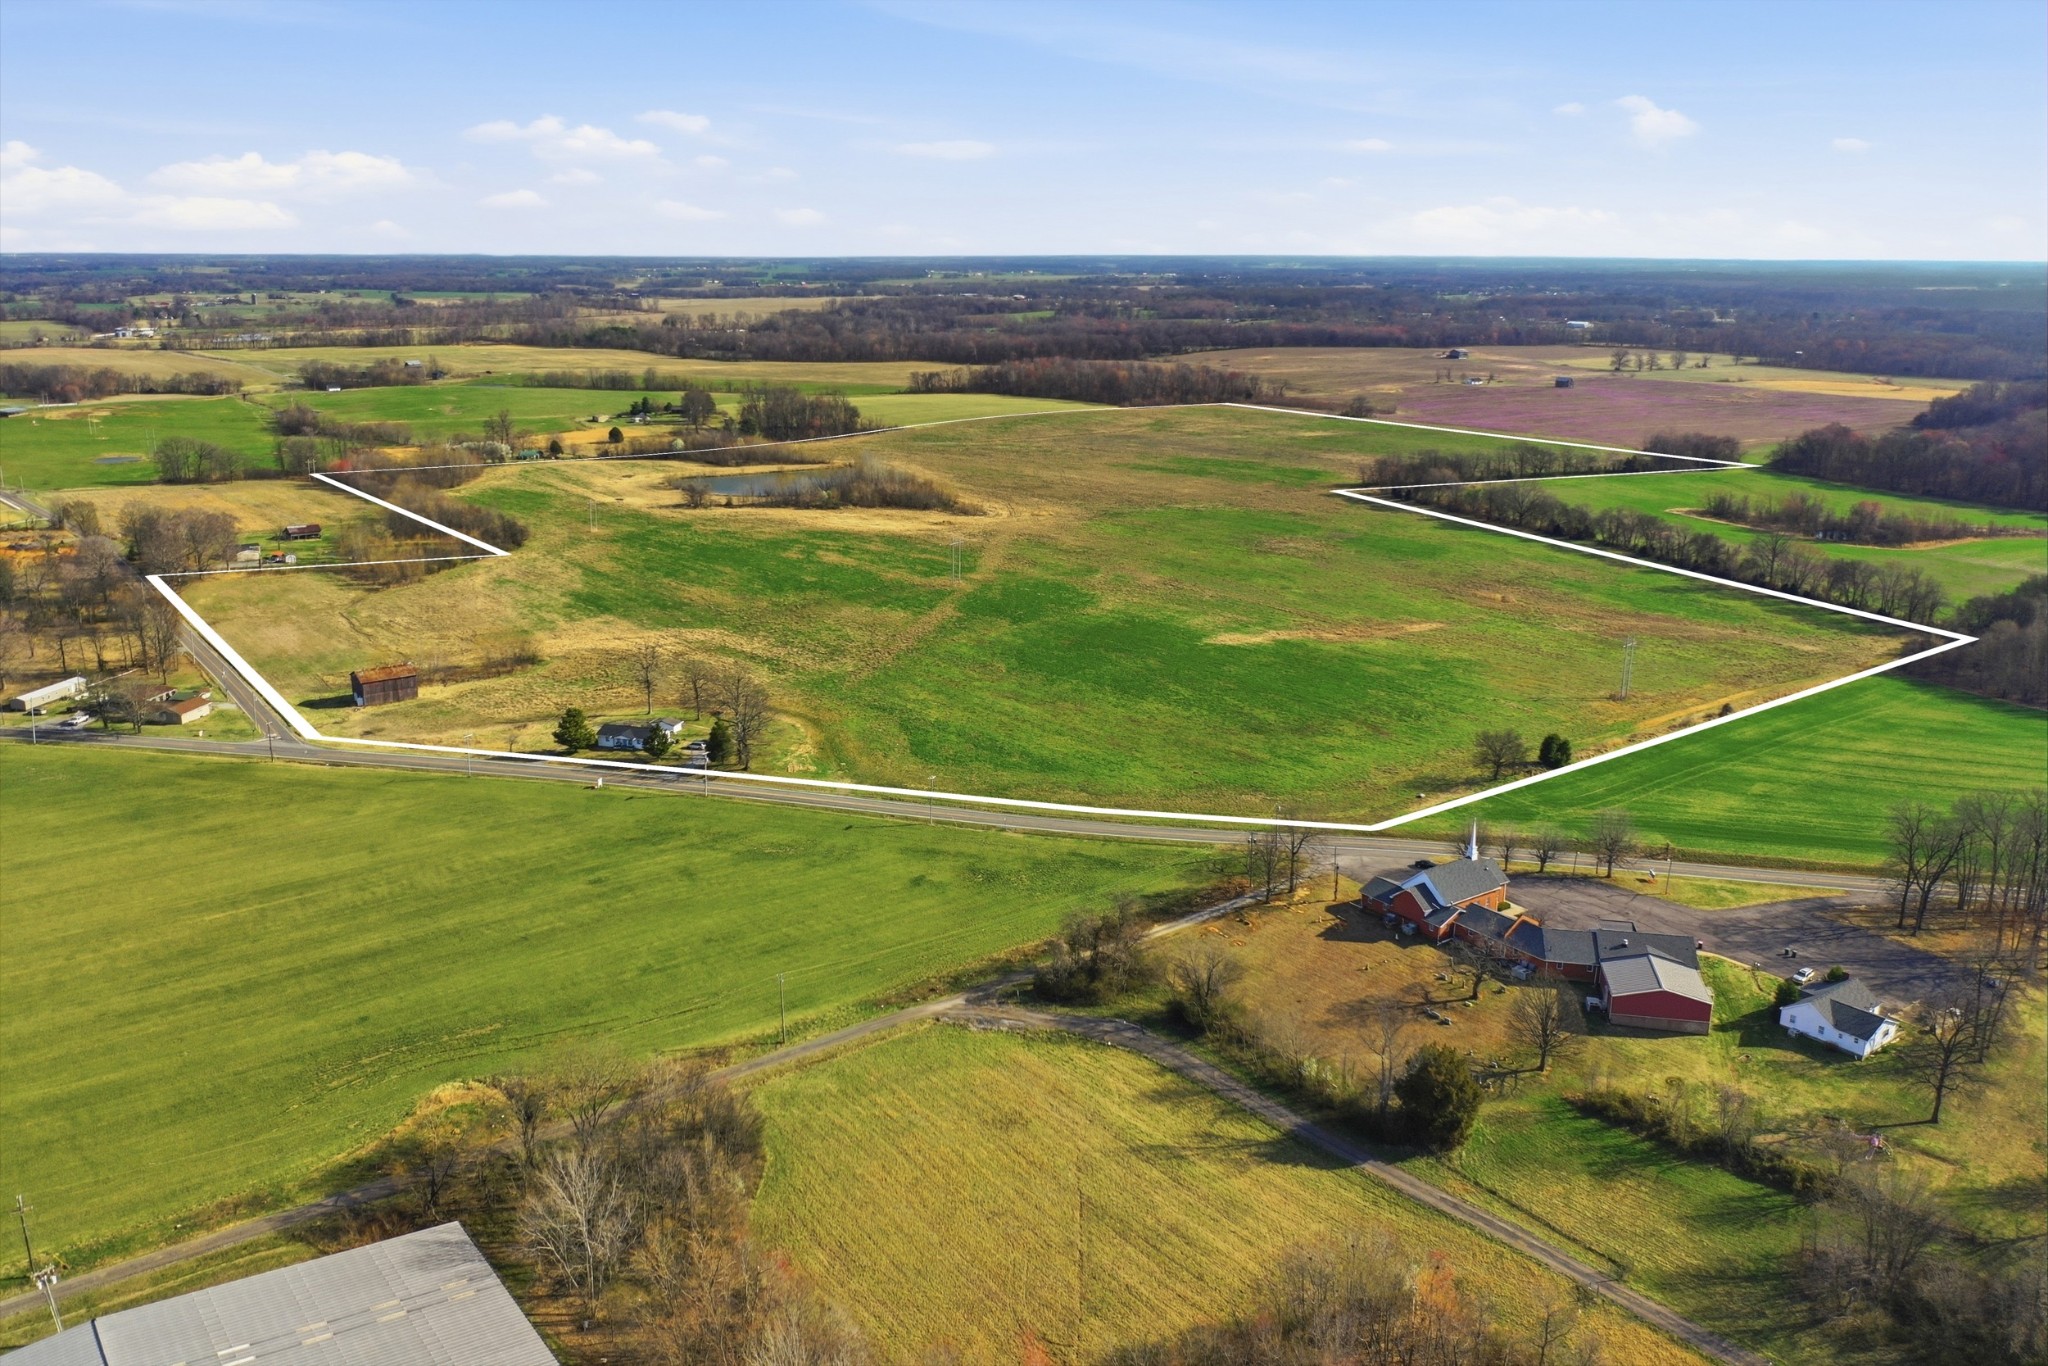
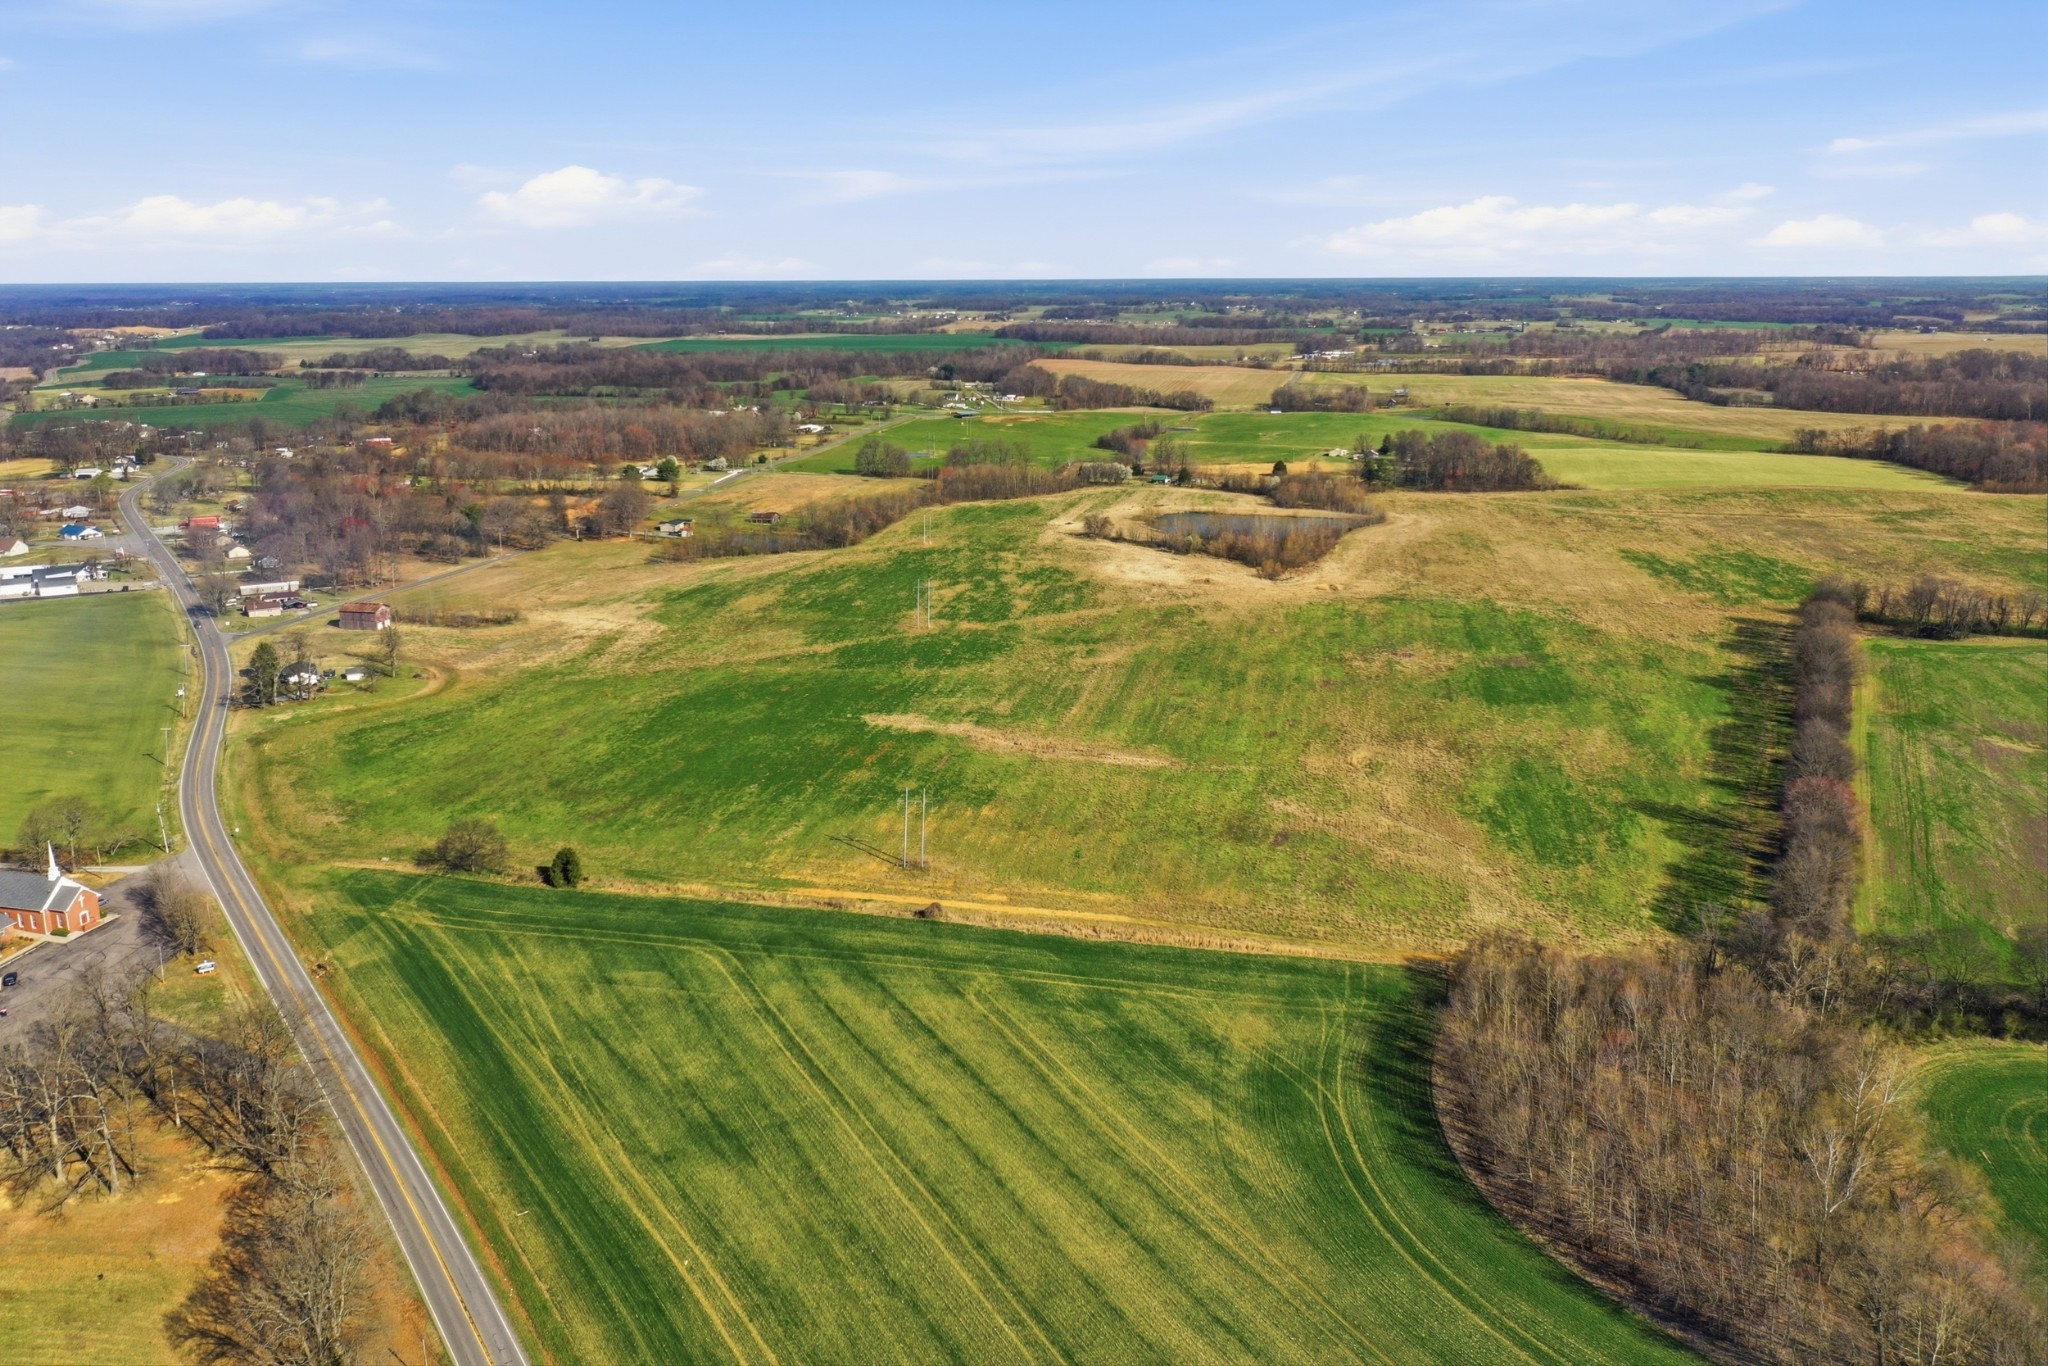
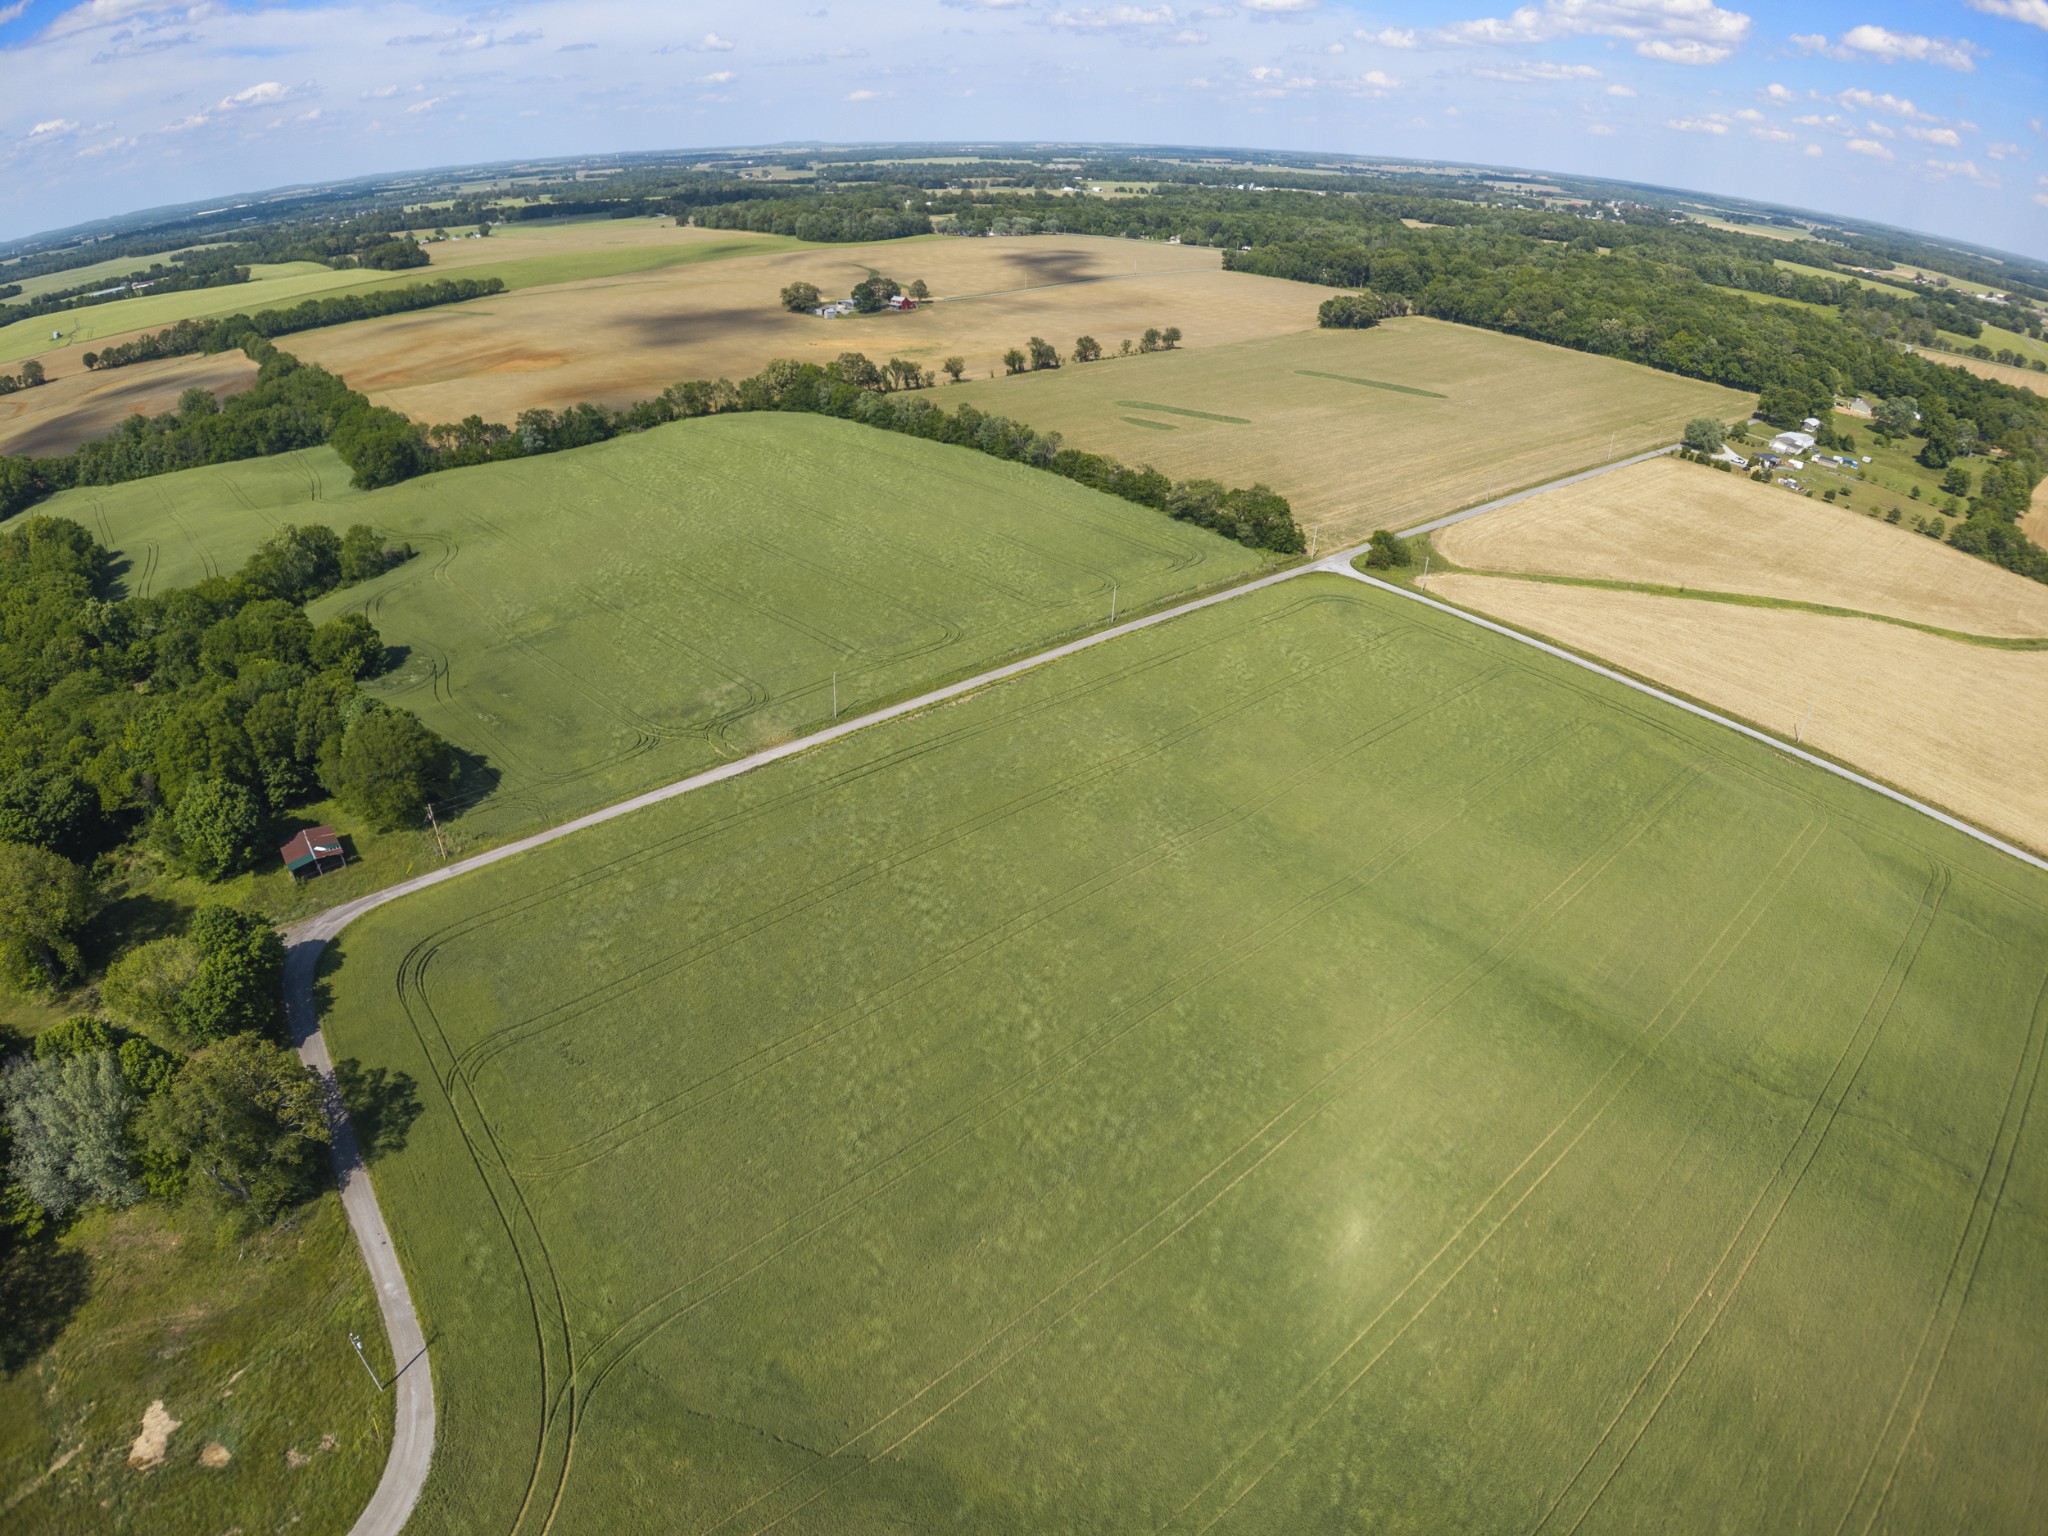
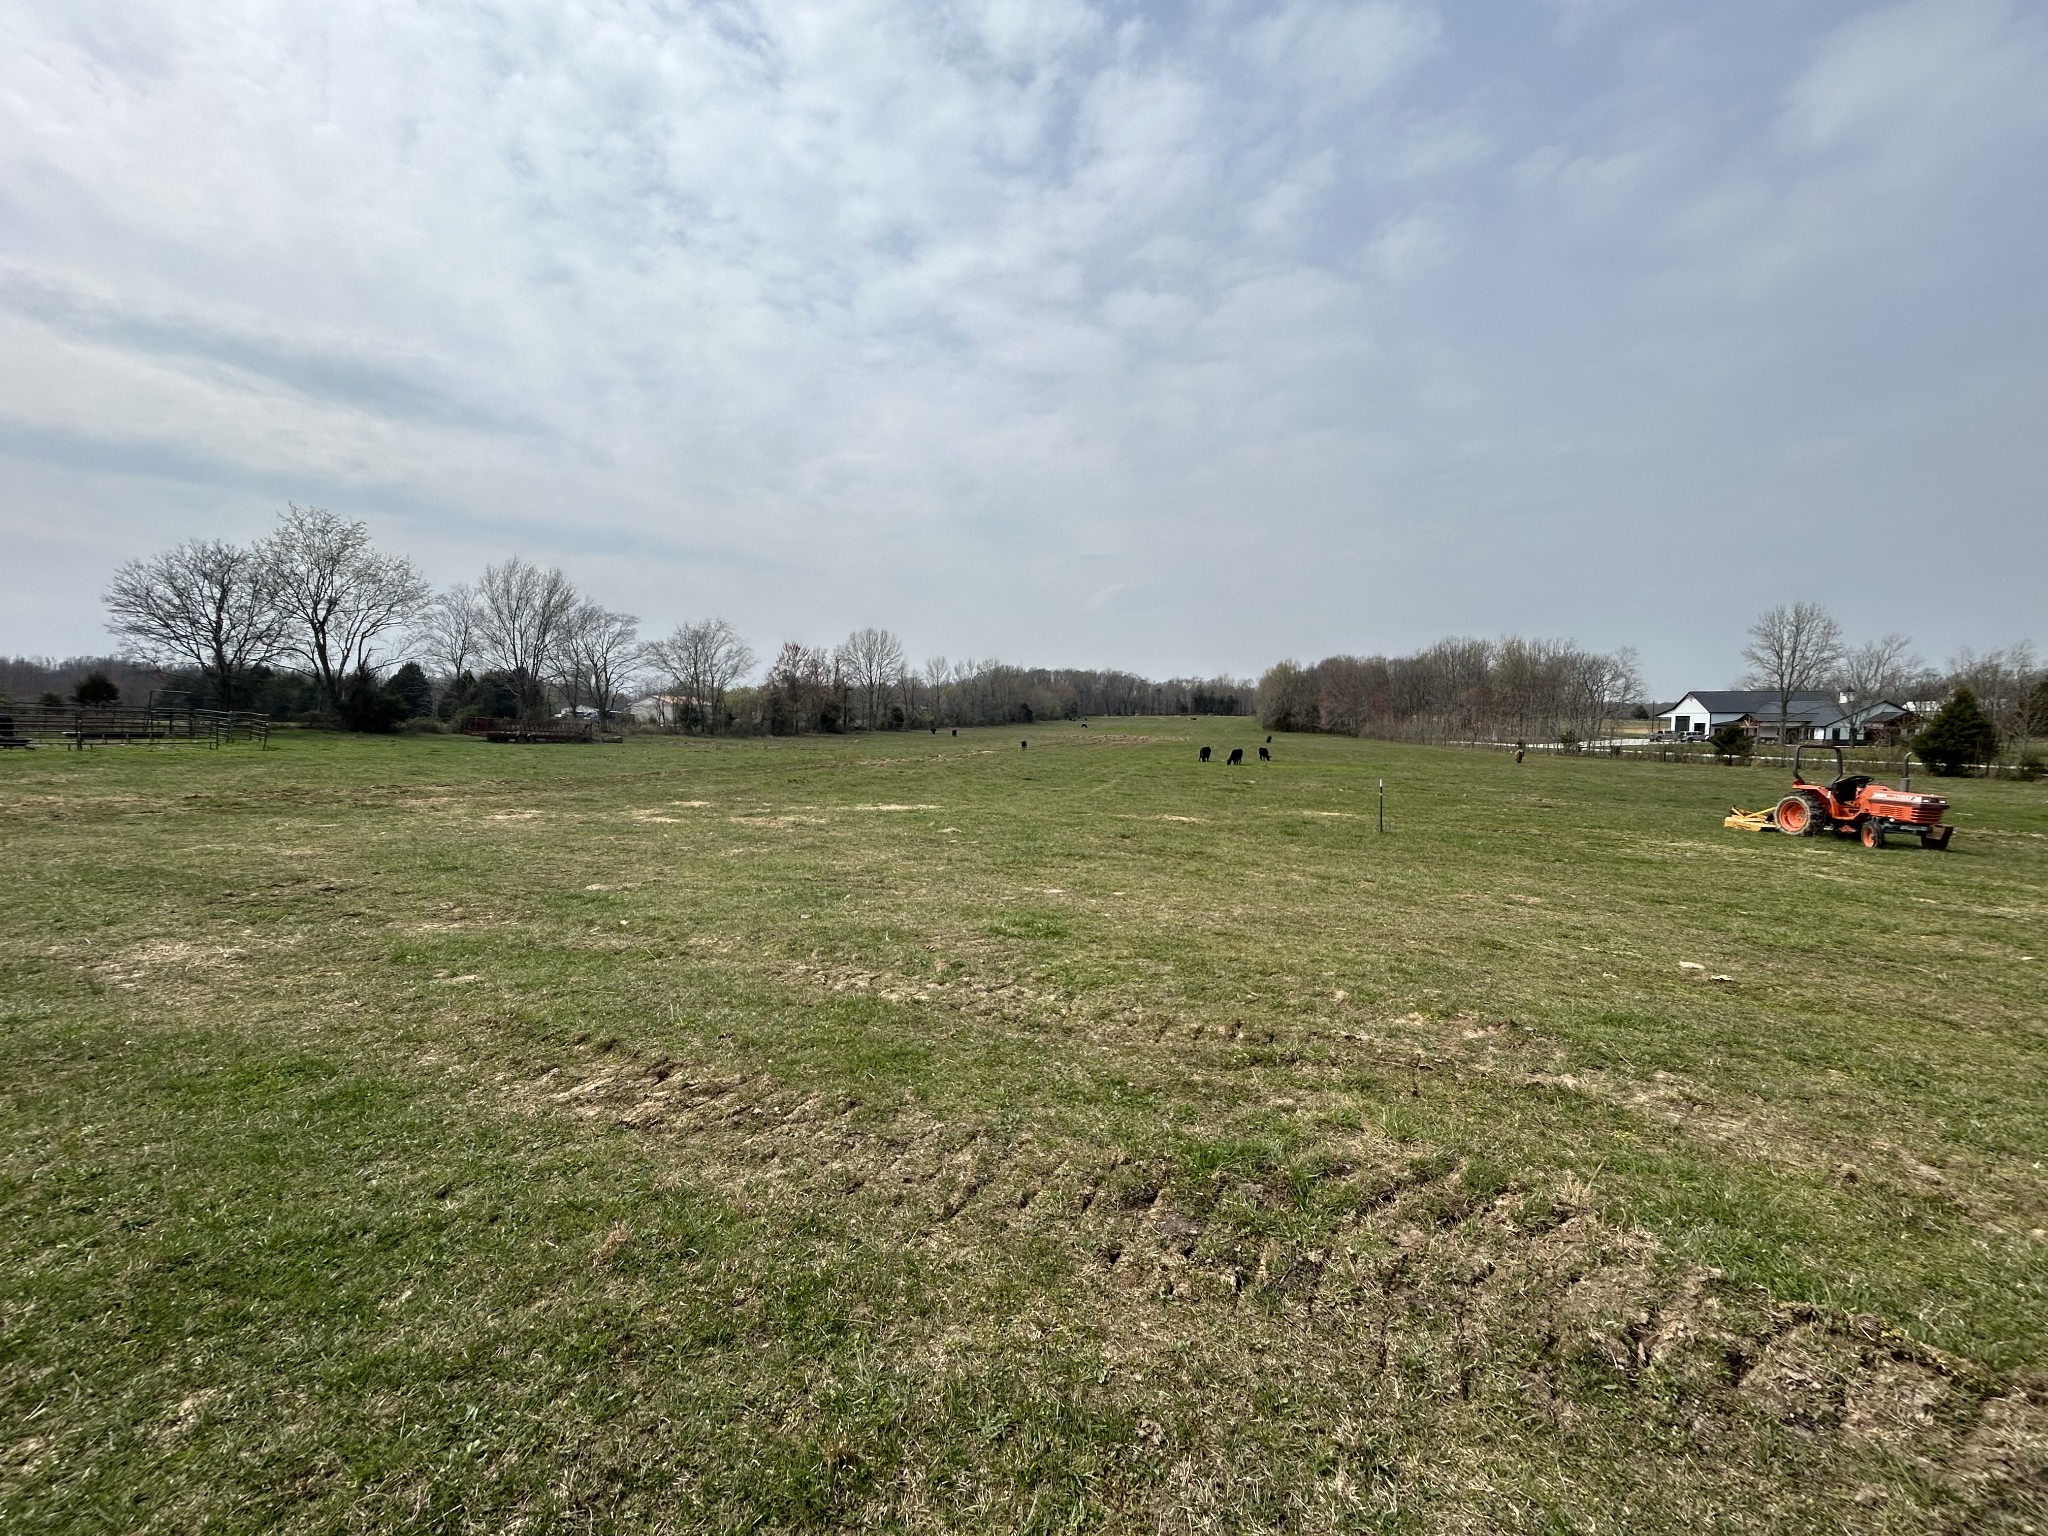
Springfield offers a mix of historic homes, newer subdivisions, and rural properties with larger lots. Because of that variety, home values can differ significantly depending on location, acreage, and overall condition. Demand has grown as buyers look outside Nashville for more space and affordability. Homes near the downtown area, established neighborhoods, and properties with usable land often follow different pricing trends. Access to Highway 41, proximity to local schools, and commute time toward Nashville can all influence buyer demand and overall property value.
When determining what your home is worth in Springfield TN, recently closed sales provide the most accurate data. Active listings show current competition, but closed transactions reflect what buyers were actually willing to pay. A proper Springfield CMA compares similar homes and adjusts for square footage, lot size, upgrades, and condition. Property features can make a noticeable difference in value. Renovated interiors, updated systems, detached garages, barns, or additional acreage may increase pricing potential. Homes that require repairs or modernization typically trade at a discount compared to updated comparables.
If you are considering selling, refinancing, or simply monitoring your investment, reviewing accurate local comparable sales is essential. A Springfield property valuation based on real market data helps you understand your home’s true position in today’s market.
31,420 people live in Springfield, where the median age is 39.6 and the average individual income is $34,103. Data provided by the U.S. Census Bureau.
Total Population
Median Age
Population Density Population Density This is the number of people per square mile in a neighborhood.
Average individual Income
There's plenty to do around Springfield, including shopping, dining, nightlife, parks, and more. Data provided by Walk Score and Yelp.
Explore popular things to do in the area, including Galbiya, Tacos Y Salsas, and Historic Perk.
| Name | Category | Distance | Reviews |
Ratings by
Yelp
|
|---|---|---|---|---|
| Dining | 3.33 miles | 54 reviews | 4.9/5 stars | |
| Dining · $ | 2.94 miles | 10 reviews | 4.8/5 stars | |
| Dining · $ | 2.43 miles | 66 reviews | 4.8/5 stars | |
| Dining · $ | 2.82 miles | 16 reviews | 4.8/5 stars | |
| Dining | 2.67 miles | 51 reviews | 4.7/5 stars | |
| Dining · $$ | 2.53 miles | 16 reviews | 4.6/5 stars | |
| Dining · $ | 3.83 miles | 48 reviews | 4.5/5 stars | |
| Dining | 3.05 miles | 7 reviews | 4.4/5 stars | |
| Shopping | 2.43 miles | 3 reviews | 5/5 stars | |
| Active | 3.73 miles | 10 reviews | 4.5/5 stars | |
| Nightlife | 2.42 miles | 19 reviews | 5/5 stars | |
| Beauty | 2.45 miles | 5 reviews | 4.6/5 stars | |
| Beauty | 2.81 miles | 3 reviews | 5/5 stars | |
|
|
||||
|
|
||||
|
|
||||
|
|
||||
|
|
||||
|
|
Springfield has 11,626 households, with an average household size of 2.64. Data provided by the U.S. Census Bureau. Here’s what the people living in Springfield do for work — and how long it takes them to get there. Data provided by the U.S. Census Bureau. 31,420 people call Springfield home. The population density is 174.78 and the largest age group is Data provided by the U.S. Census Bureau.
Total Population
Population Density Population Density This is the number of people per square mile in a neighborhood.
Median Age
Men vs Women
Population by Age Group
0-9 Years
10-17 Years
18-24 Years
25-64 Years
65-74 Years
75+ Years
Education Level
Total Households
Average Household Size
Average individual Income
Households with Children
With Children:
Without Children:
Marital Status
Blue vs White Collar Workers
Blue Collar:
White Collar:
Offering clients personalized representation, tailored marketing strategies, and premium service. Consistently surpassing expectations for buyers, sellers, and others.