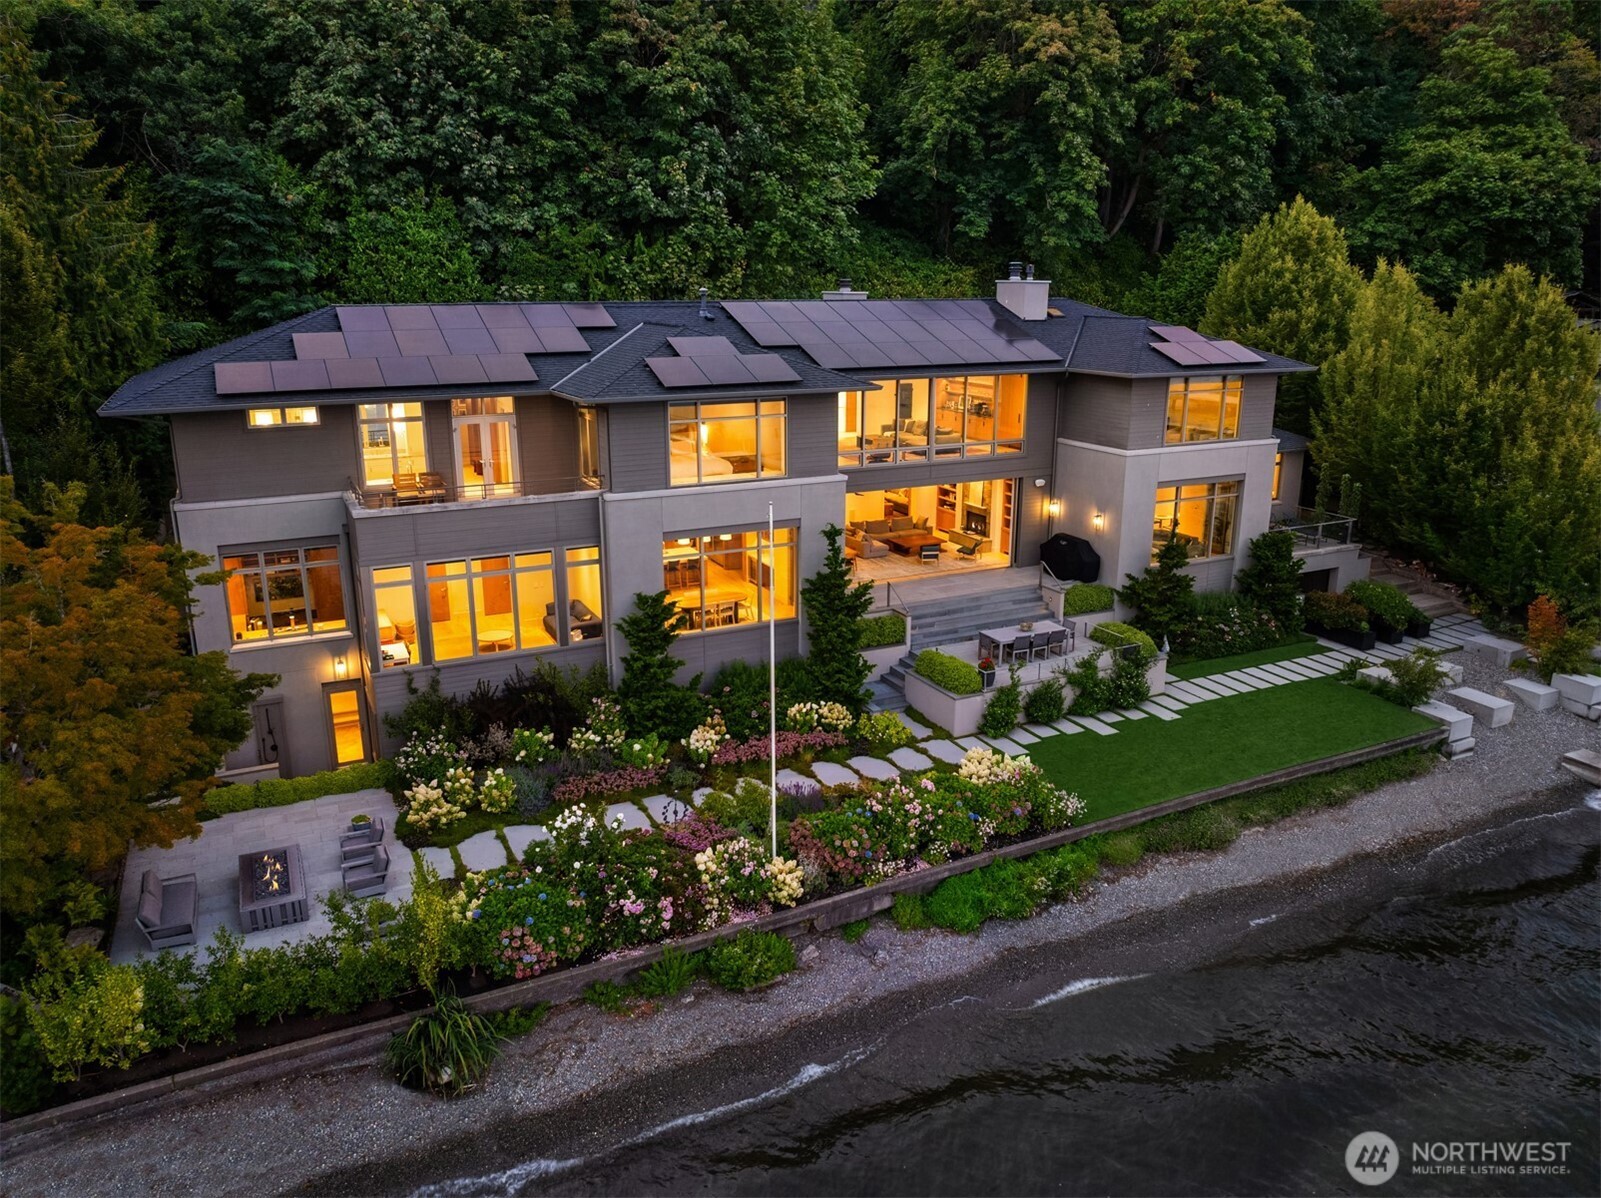
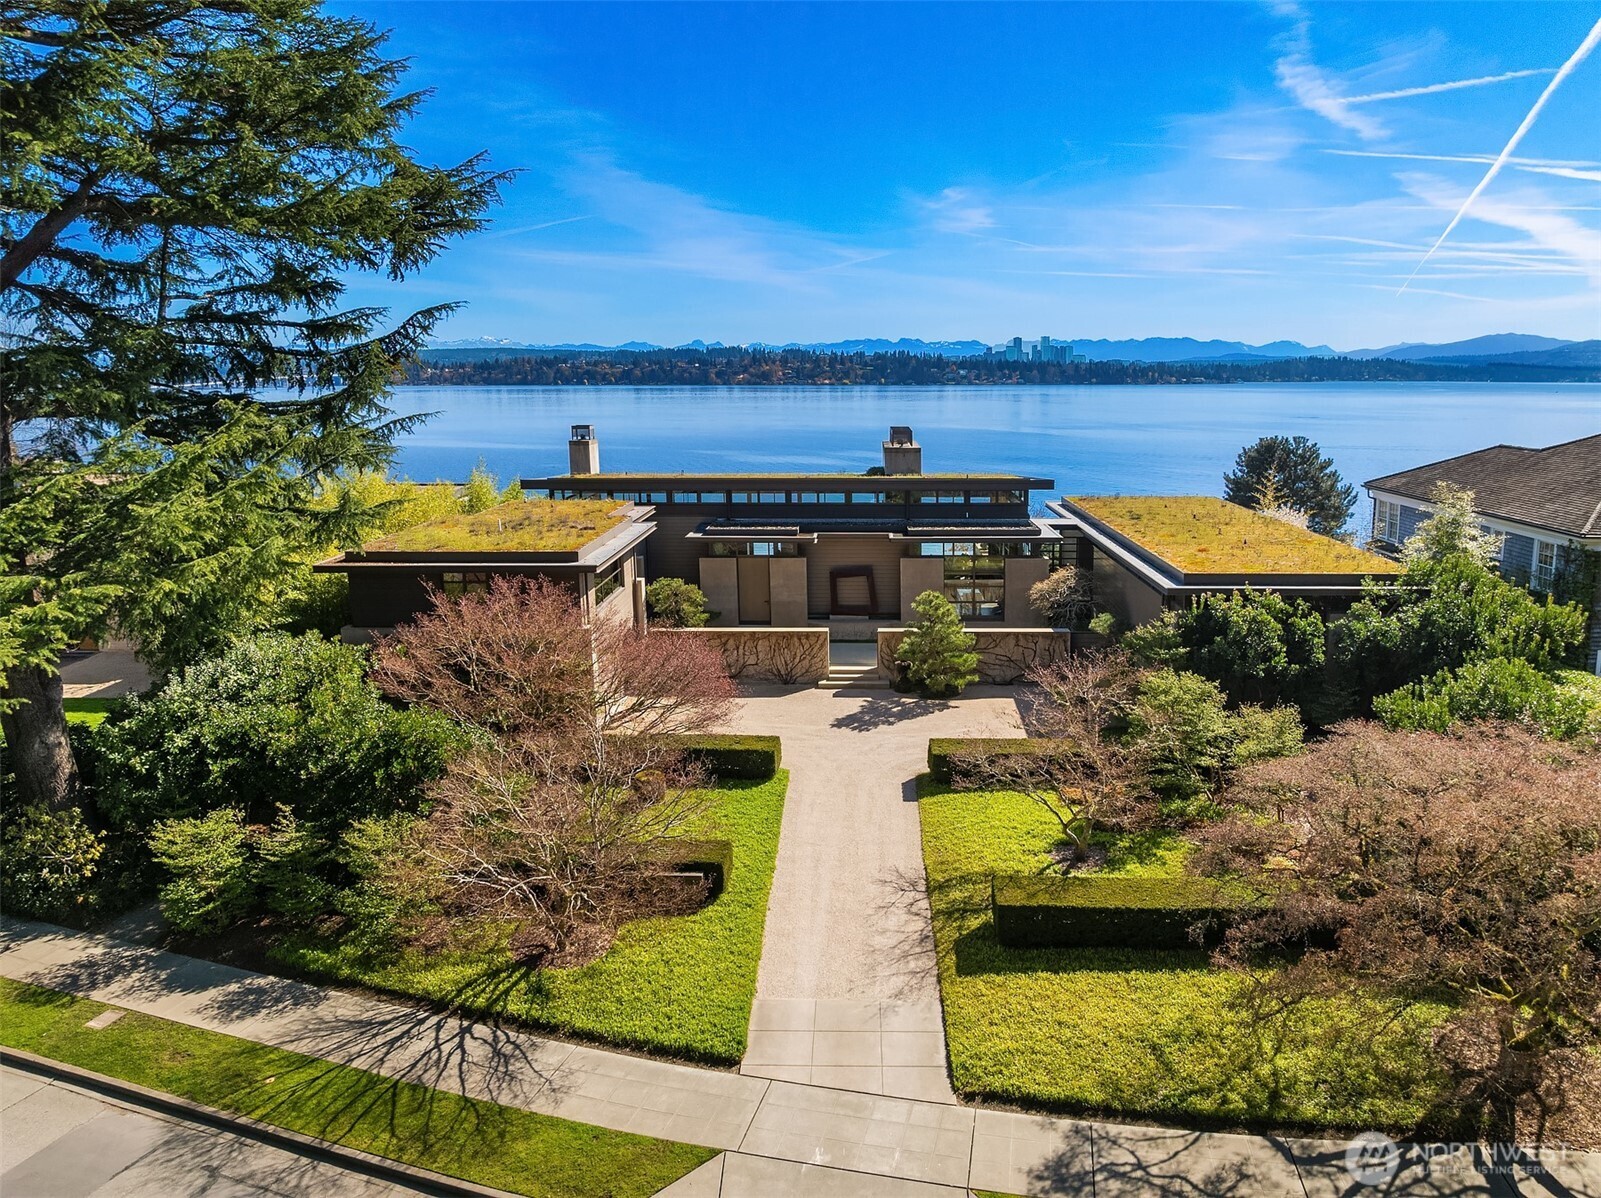
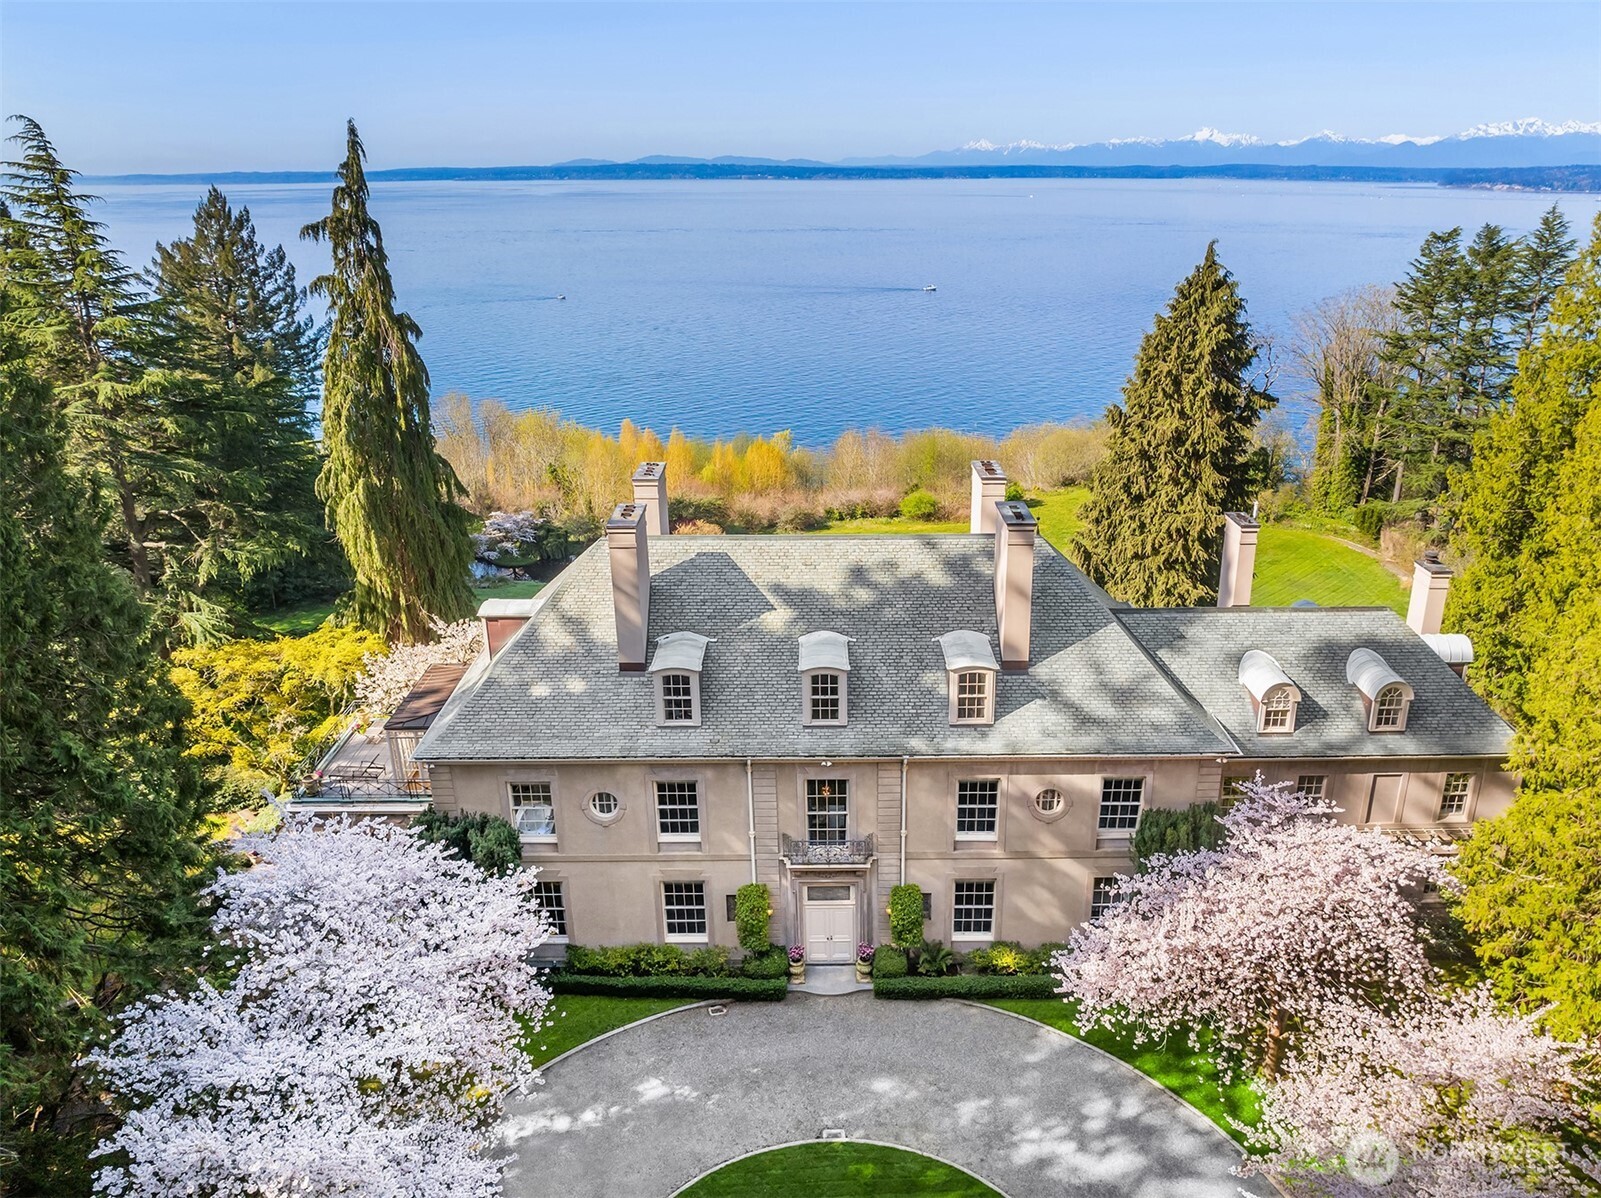
Seattle’s real estate market is well known for its diversity of neighborhoods, distinctive housing stock, and often premium pricing compared to national averages. Median home prices across the city can hover in the high $700,000s to $800,000s or more, reflecting strong demand and limited inventory in certain areas. The exact value of your home will depend on location, property features, and recent sales data. Different parts of Seattle have very different pricing trends. Waterfront and view properties near neighborhoods like West Seattle, Queen Anne, or Capitol Hill often command significant premiums compared to areas further inland. Proximity to tech and employment hubs, walkability, transit access, and school districts all play a role in how buyers value homes in specific neighborhoods.
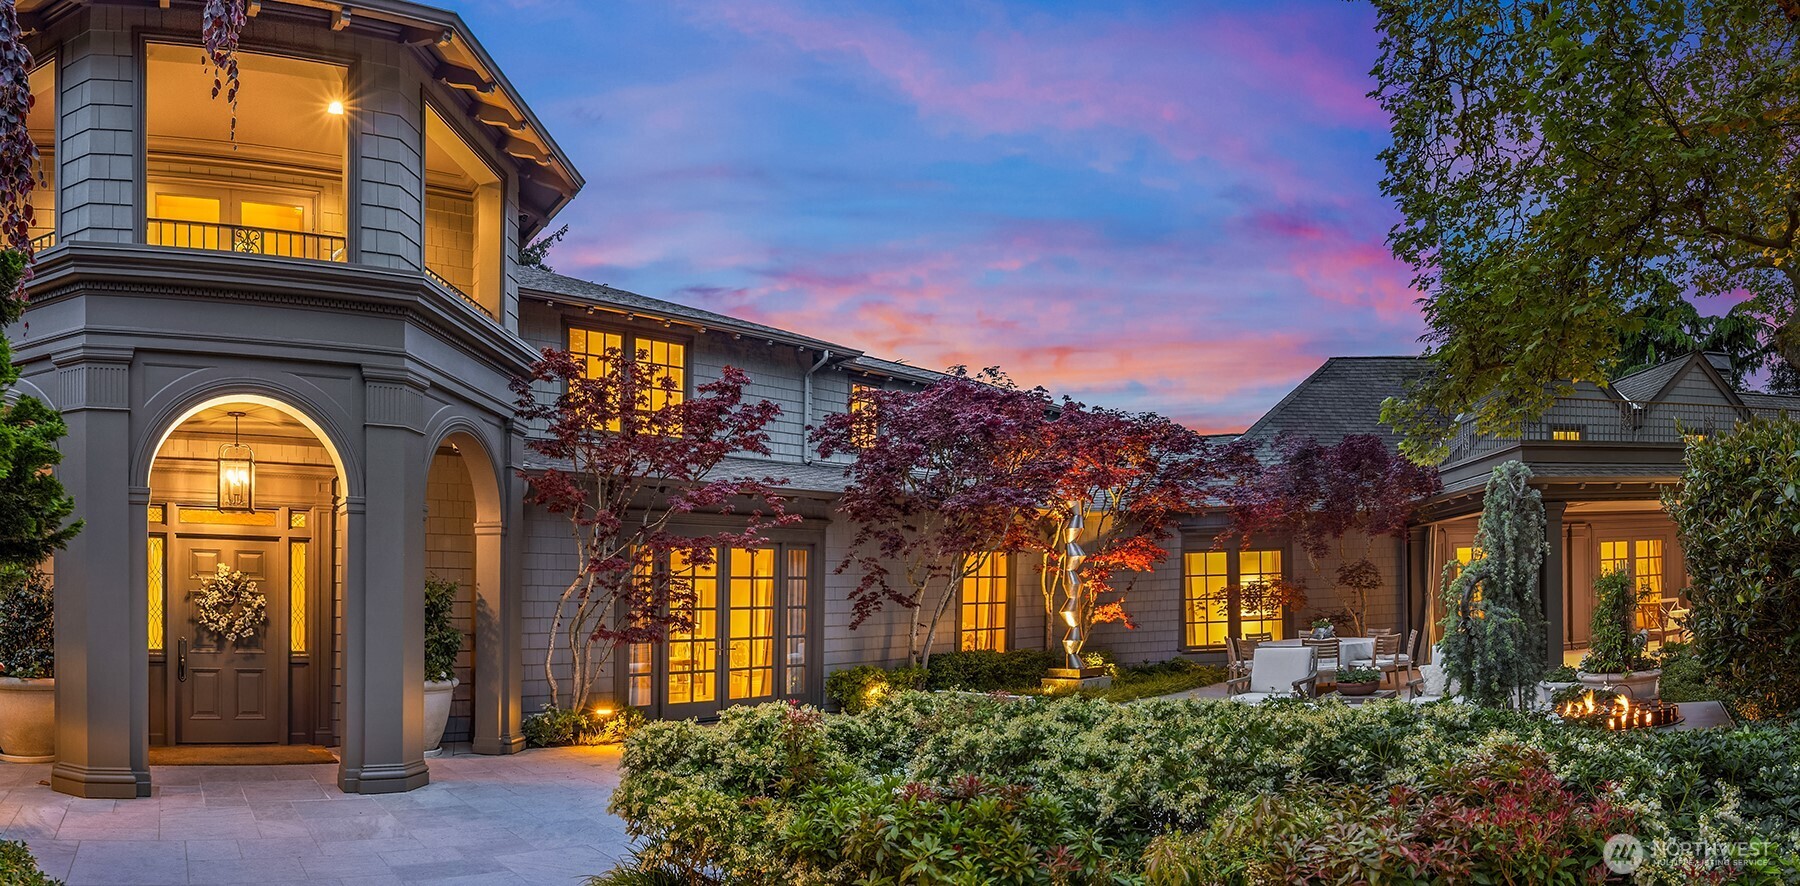
When estimating what your home is worth in Seattle WA, the most reliable approach is a detailed comparative market analysis. A Seattle CMA looks at recently closed sales of similar properties — similar in size, condition, age, and location — and adjusts for differences to determine realistic market value. This method gives a clearer picture than relying on generic online estimates. Home condition and upgrades matter, especially in Seattle’s competitive environment. Updated kitchens, modernized bathrooms, energy efficient systems, and strong curb appeal can increase a property’s estimated value compared to similar homes that lack those updates. Conversely, properties in need of renovation often sell at a discount relative to updated comps.
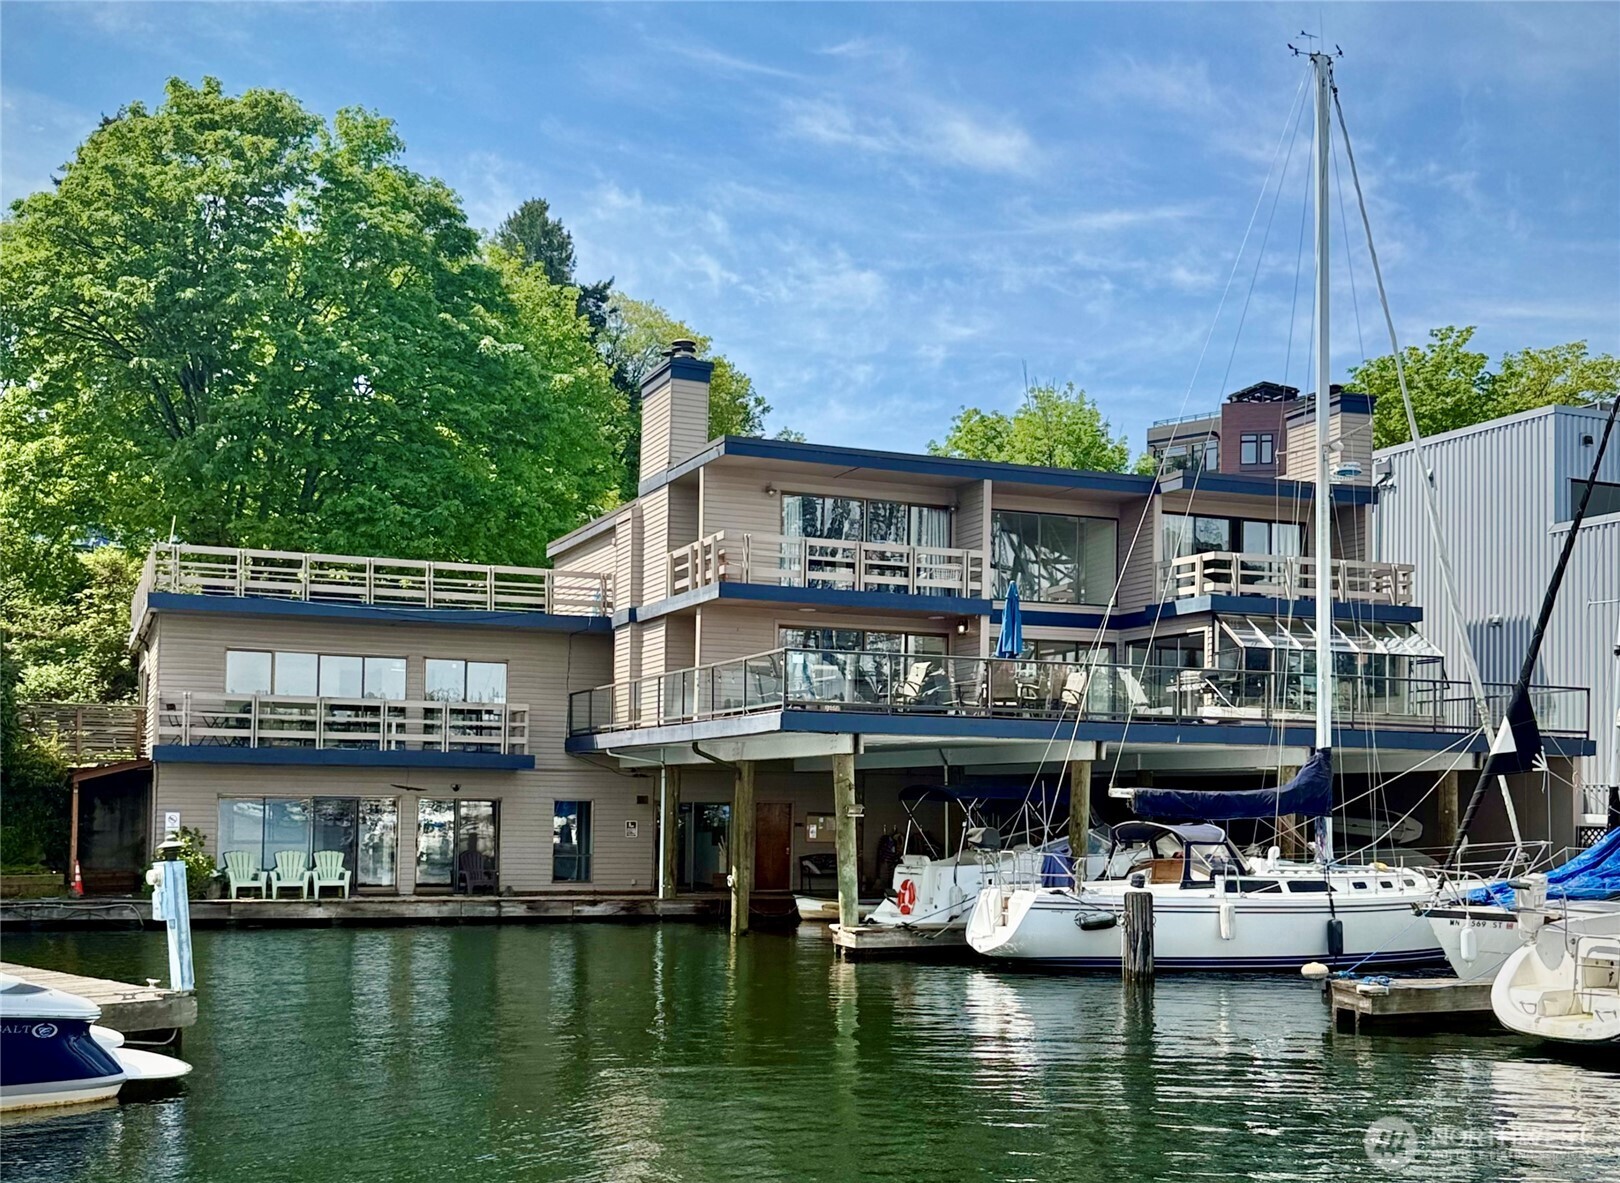
Market trends also influence valuation. Seattle’s housing market can shift with changes in inventory levels, buyer demand, and regional employment growth. While median prices have shown both resilience and mild year-over-year fluctuation recently, reviewing recent comparable sales alongside inventory and days-on-market trends will help you understand where your Seattle property fits within the broader market.
994,393 people live in Seattle, where the median age is 36.7 and the average individual income is $74,242.494. Data provided by the U.S. Census Bureau.
Total Population
Median Age
Population Density Population Density This is the number of people per square mile in a neighborhood.
Average individual Income
There's plenty to do around Seattle, including shopping, dining, nightlife, parks, and more. Data provided by Walk Score and Yelp.
Explore popular things to do in the area, including Bucha Belly, NW Corporate Yoga, and Unstill Life.
| Name | Category | Distance | Reviews |
Ratings by
Yelp
|
|---|---|---|---|---|
| Dining | 0.24 miles | 7 reviews | 5/5 stars | |
| Active | 1.84 miles | 7 reviews | 5/5 stars | |
| Active | 1.81 miles | 12 reviews | 5/5 stars | |
| Active | 4.08 miles | 5 reviews | 5/5 stars | |
| Active | 1.91 miles | 8 reviews | 5/5 stars | |
| Active | 3.36 miles | 37 reviews | 5/5 stars | |
| Active | 0.63 miles | 13 reviews | 5/5 stars | |
| Beauty | 4.58 miles | 11 reviews | 5/5 stars | |
| Beauty | 3 miles | 6 reviews | 5/5 stars | |
| Beauty | 2.68 miles | 10 reviews | 5/5 stars | |
| Beauty | 2.46 miles | 26 reviews | 5/5 stars | |
| Beauty | 2.36 miles | 6 reviews | 5/5 stars | |
| Beauty | 2.39 miles | 7 reviews | 5/5 stars | |
| Beauty | 1.05 miles | 10 reviews | 5/5 stars | |
| Beauty | 1.82 miles | 10 reviews | 5/5 stars | |
|
|
||||
|
|
||||
|
|
||||
|
|
||||
|
|
||||
|
|
Seattle has 449,727 households, with an average household size of 73.03. Data provided by the U.S. Census Bureau. Here’s what the people living in Seattle do for work — and how long it takes them to get there. Data provided by the U.S. Census Bureau. 994,393 people call Seattle home. The population density is 10,008.916 and the largest age group is Data provided by the U.S. Census Bureau.
Total Population
Population Density Population Density This is the number of people per square mile in a neighborhood.
Median Age
Men vs Women
Population by Age Group
0-9 Years
10-17 Years
18-24 Years
25-64 Years
65-74 Years
75+ Years
Education Level
Total Households
Average Household Size
Average individual Income
Households with Children
With Children:
Without Children:
Marital Status
Blue vs White Collar Workers
Blue Collar:
White Collar:

Offering clients personalized representation, tailored marketing strategies, and premium service. Consistently surpassing expectations for buyers, sellers, and others.