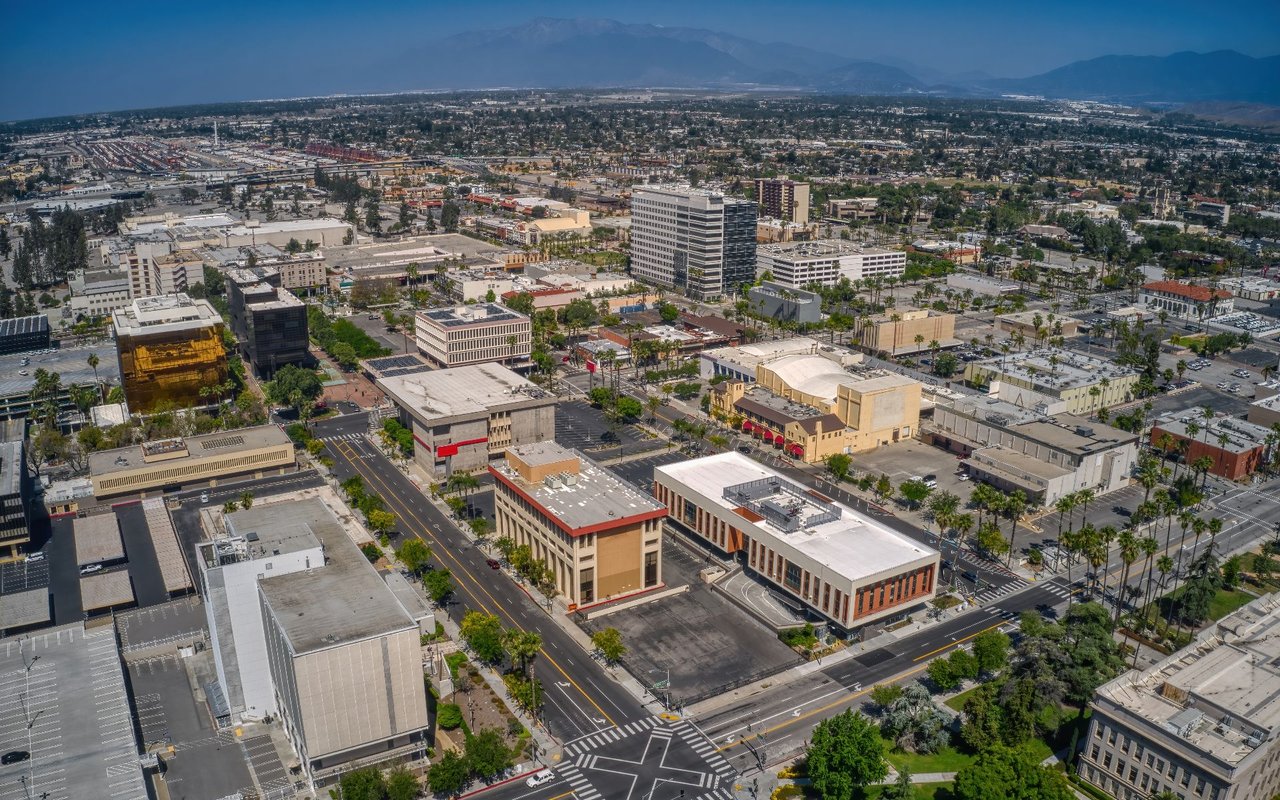
San Bernardino’s housing market is shaped by affordability, regional migration, and logistics driven employment growth across the Inland Empire. Property values can vary significantly between North San Bernardino, Arrowhead Springs, Del Rosa, and areas closer to downtown. Homes near the foothills may operate within a different pricing tier than properties in denser urban sections. Single family residences represent a large portion of overall market activity. Entry and mid range price points often attract first time buyers relocating from Los Angeles County. Condition and major system updates frequently influence final sale prices more than cosmetic details. Proximity to major highways such as the 215 and 210 can affect commuter demand. Lot size and street location may impact perceived value within specific neighborhoods. Inventory levels may fluctuate depending on regional migration patterns. Determining accurate value in San Bernardino requires analyzing neighborhood specific sales rather than relying on broader county averages.
Buyer behavior in San Bernardino often reflects affordability relative to surrounding markets. Homes priced in line with recent local activity may attract steady showing traffic. Overpricing can quickly reduce interest in price sensitive segments. Properties requiring significant repairs may trade below neighborhood benchmarks. Investor participation can influence demand in certain areas. Days on market trends help signal whether pricing aligns with buyer expectations. Interest rate movement can impact qualification ranges and purchasing power. New housing development in nearby cities may shift competitive positioning. Well maintained homes typically negotiate from a stronger stance. A localized pricing review provides clearer guidance than automated valuation tools.
San Bernardino continues to benefit from population growth within the Inland Empire. Buyers relocating from higher cost coastal markets often compare pricing across regional alternatives. Infrastructure expansion and commercial development may influence long term appreciation. Strategic pricing improves the likelihood of attracting qualified buyers efficiently. Micro market differences can exist even within the same zip code. Market pace may shift depending on inventory supply and economic conditions. Proper preparation strengthens overall listing performance. Understanding neighborhood level demand enhances negotiation outcomes. Whether preparing to sell or reviewing equity, accurate valuation analysis is essential. A San Bernardino focused home value assessment grounded in current neighborhood performance provides dependable pricing clarity.
255,071 people live in San Bernardino, where the median age is 31.1 and the average individual income is $24,286.647. Data provided by the U.S. Census Bureau.
Total Population
Median Age
Population Density Population Density This is the number of people per square mile in a neighborhood.
Average individual Income
There's plenty to do around San Bernardino, including shopping, dining, nightlife, parks, and more. Data provided by Walk Score and Yelp.
Explore popular things to do in the area, including Paper & Clay, and Keep Your Crown Right.
| Name | Category | Distance | Reviews |
Ratings by
Yelp
|
|---|---|---|---|---|
| Shopping | 4.92 miles | 8 reviews | 5/5 stars | |
| Beauty | 3.82 miles | 21 reviews | 5/5 stars | |
|
|
||||
|
|
||||
|
|
||||
|
|
||||
|
|
||||
|
|
San Bernardino has 71,286 households, with an average household size of 24.15. Data provided by the U.S. Census Bureau. Here’s what the people living in San Bernardino do for work — and how long it takes them to get there. Data provided by the U.S. Census Bureau. 255,071 people call San Bernardino home. The population density is 3,312.12 and the largest age group is Data provided by the U.S. Census Bureau.
Total Population
Population Density Population Density This is the number of people per square mile in a neighborhood.
Median Age
Men vs Women
Population by Age Group
0-9 Years
10-17 Years
18-24 Years
25-64 Years
65-74 Years
75+ Years
Education Level
Total Households
Average Household Size
Average individual Income
Households with Children
With Children:
Without Children:
Marital Status
Blue vs White Collar Workers
Blue Collar:
White Collar:
Offering clients personalized representation, tailored marketing strategies, and premium service. Consistently surpassing expectations for buyers, sellers, and others.


