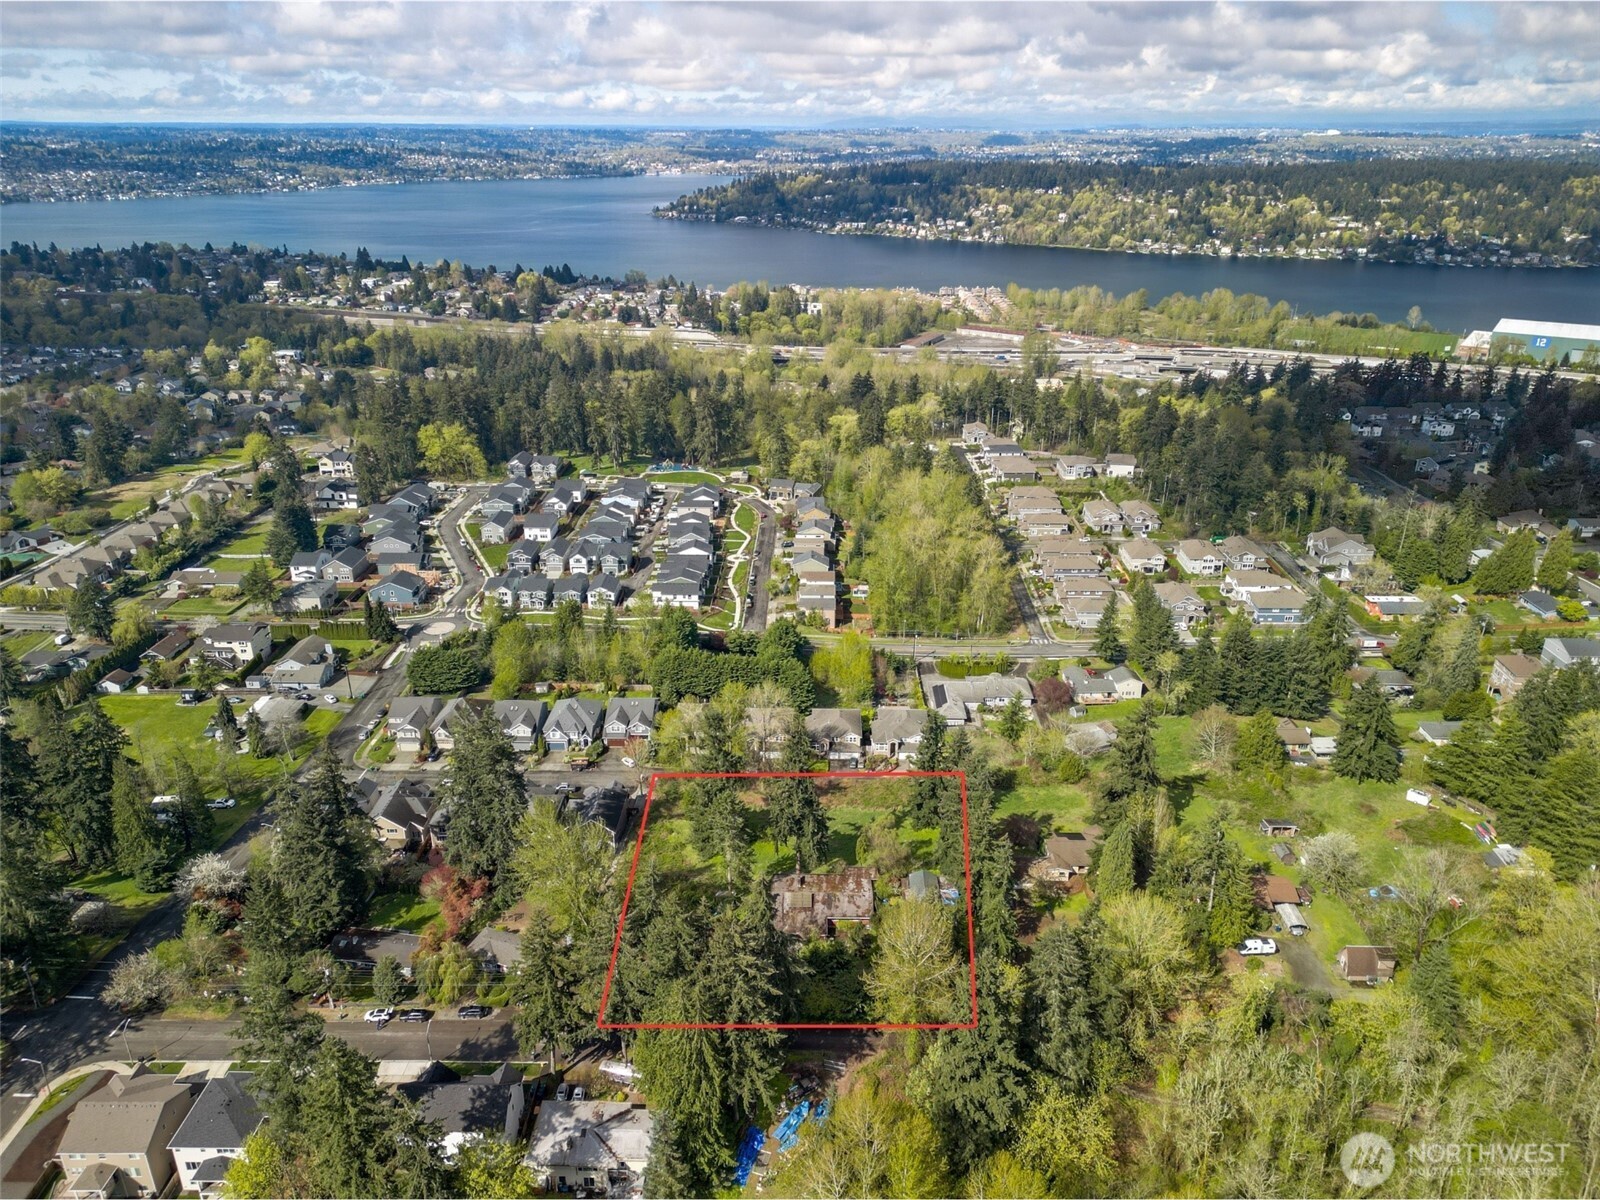
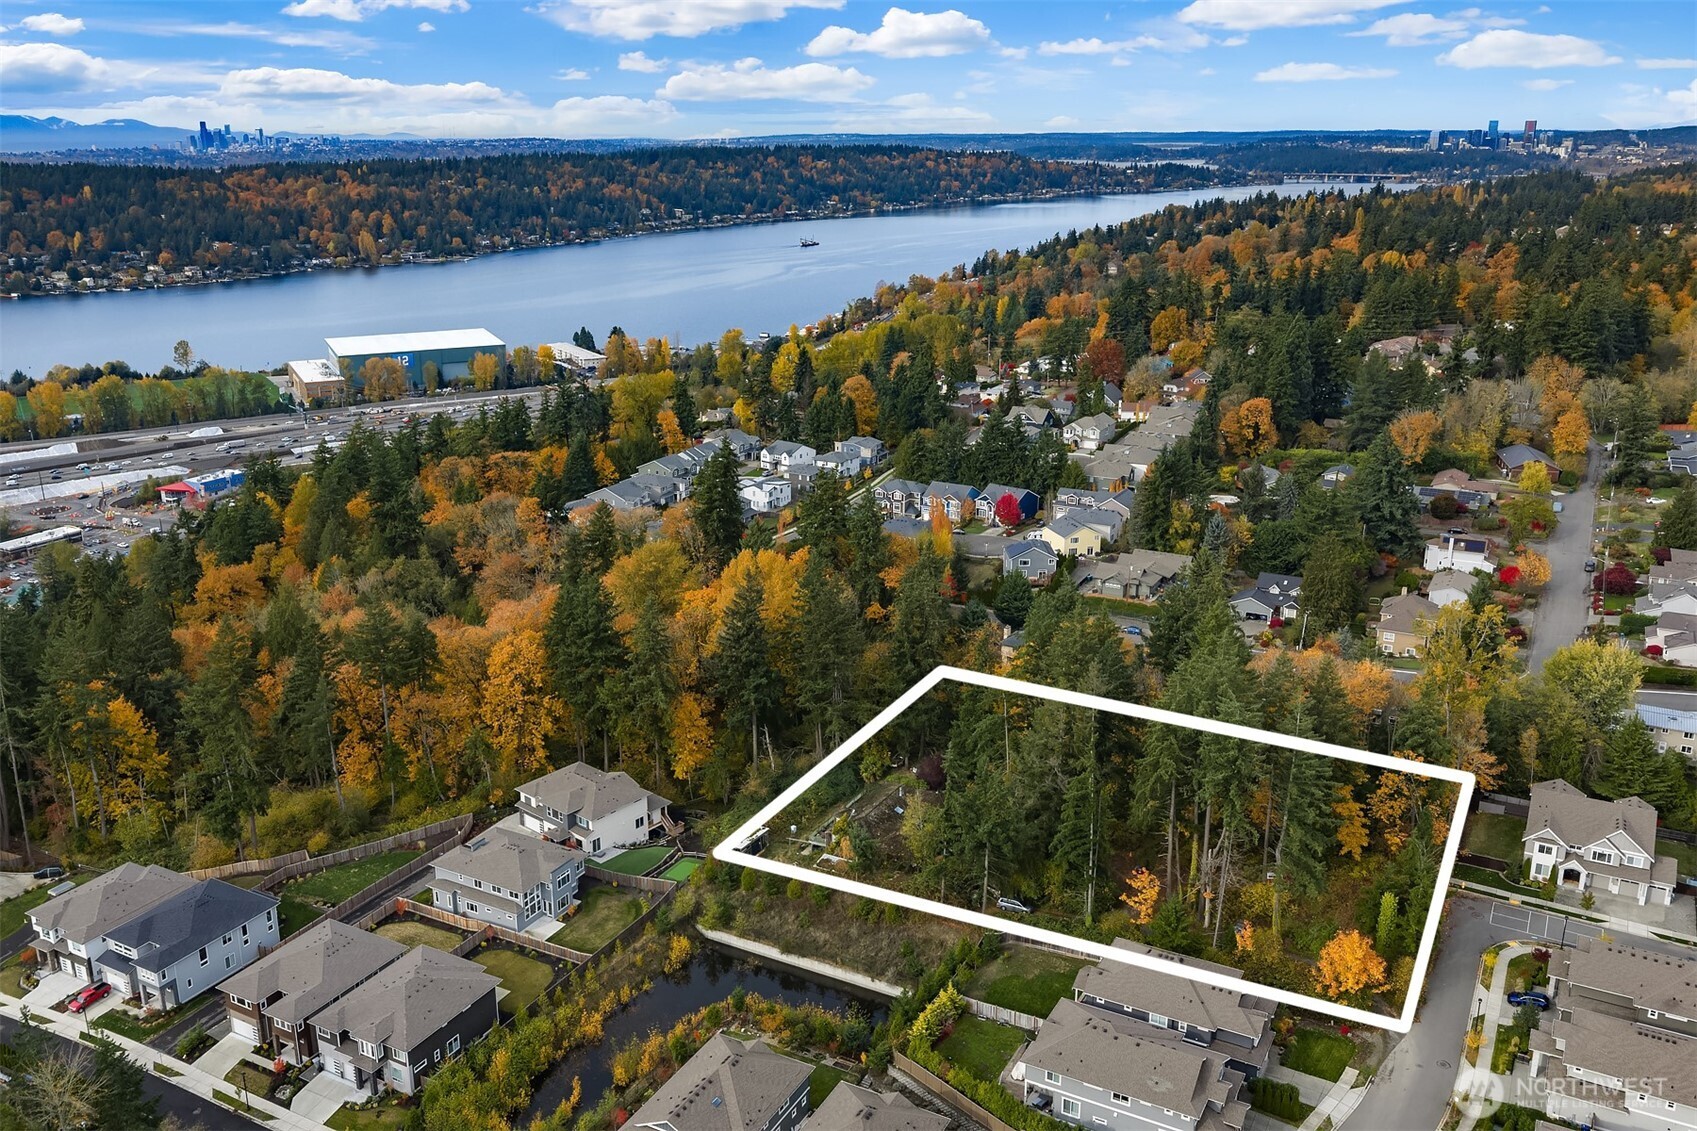
Renton is one of the most strategically located real estate markets in the Seattle metropolitan area, offering a mix of established neighborhoods, newer developments, and desirable lakefront properties. If you are searching what is my home worth in Renton WA, the answer depends on location, property type, condition, and recent comparable sales in your immediate area. Values can vary significantly between the Highlands, Kennydale, Fairwood, and homes near The Landing.
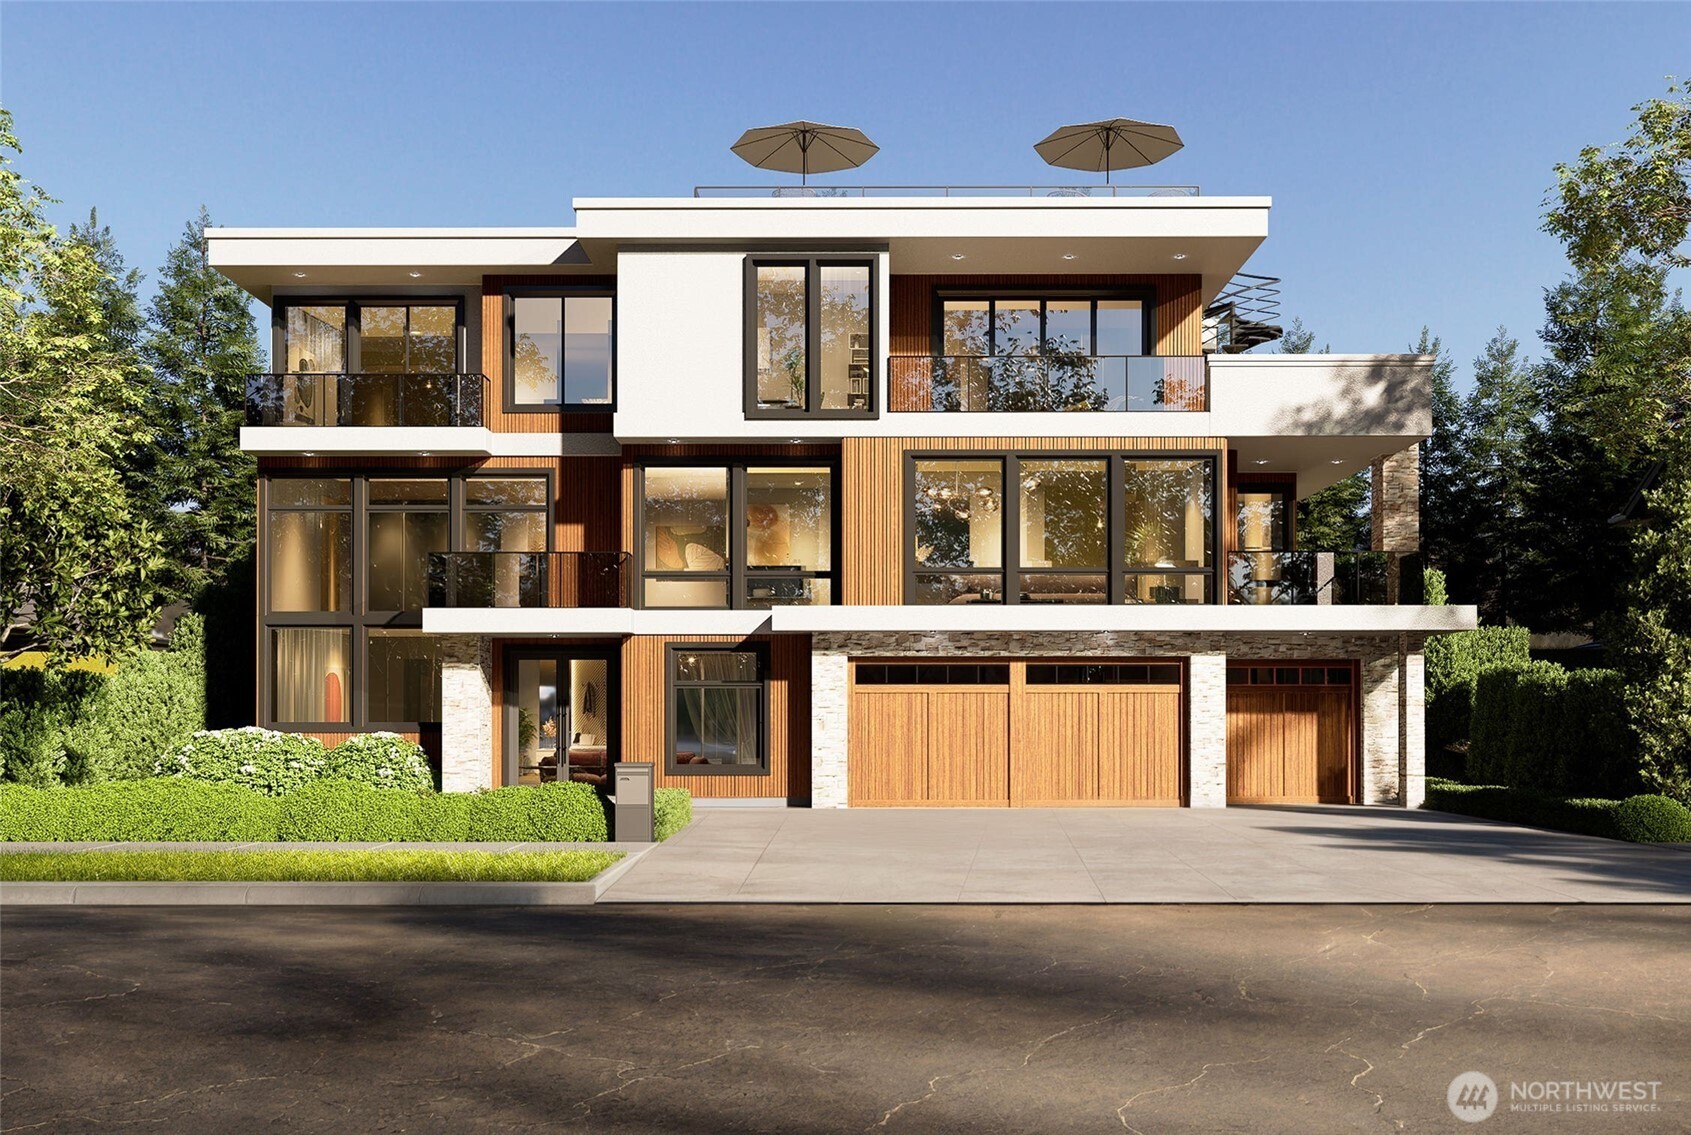
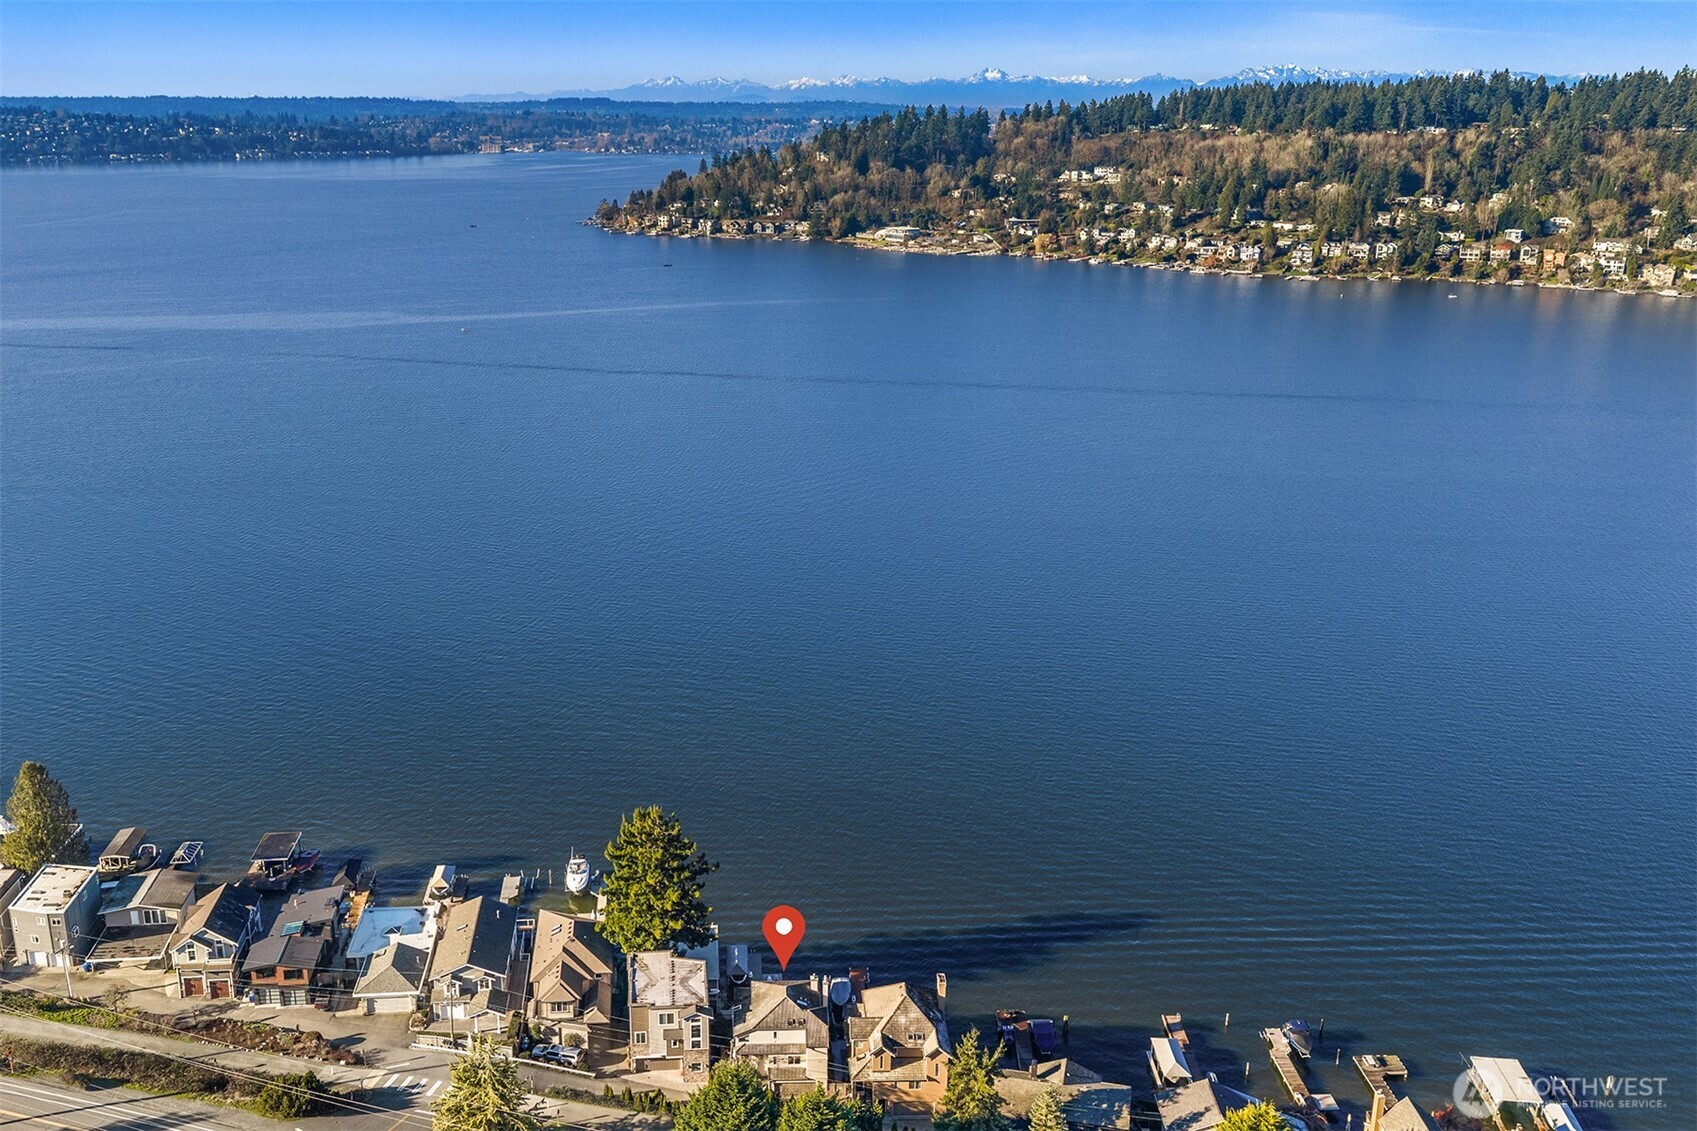
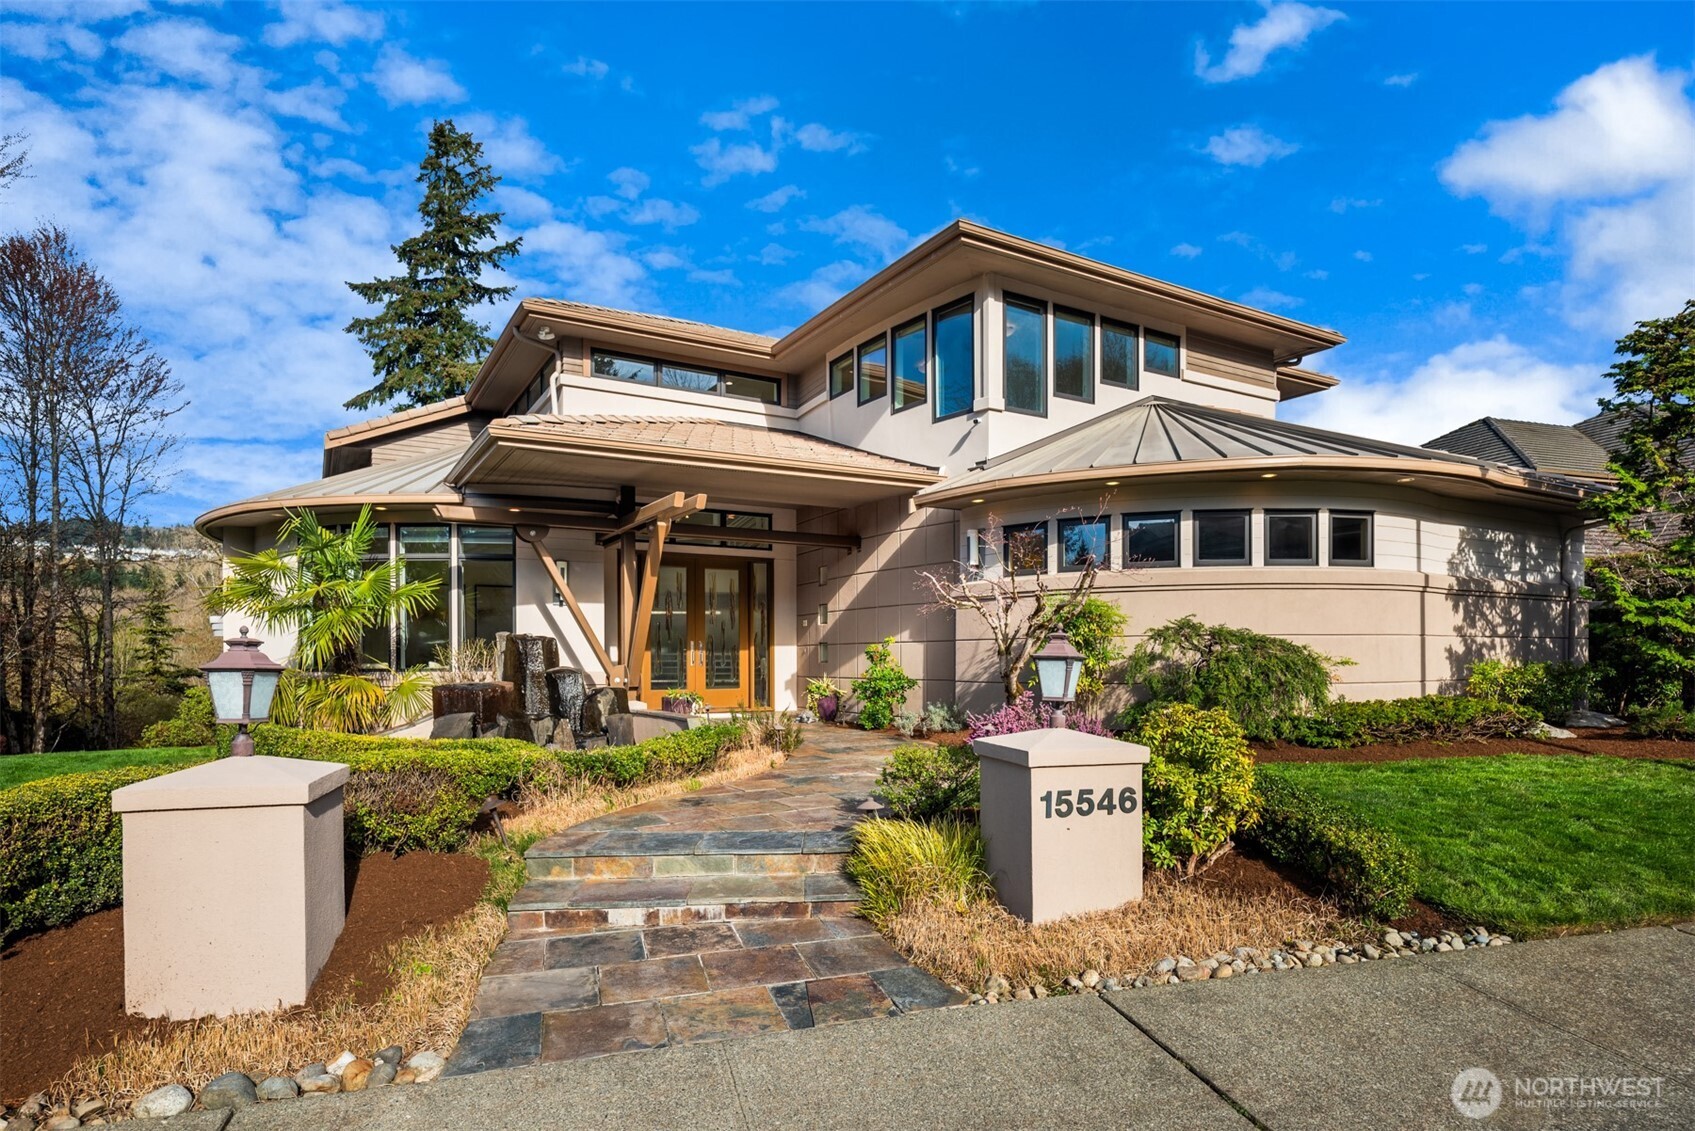
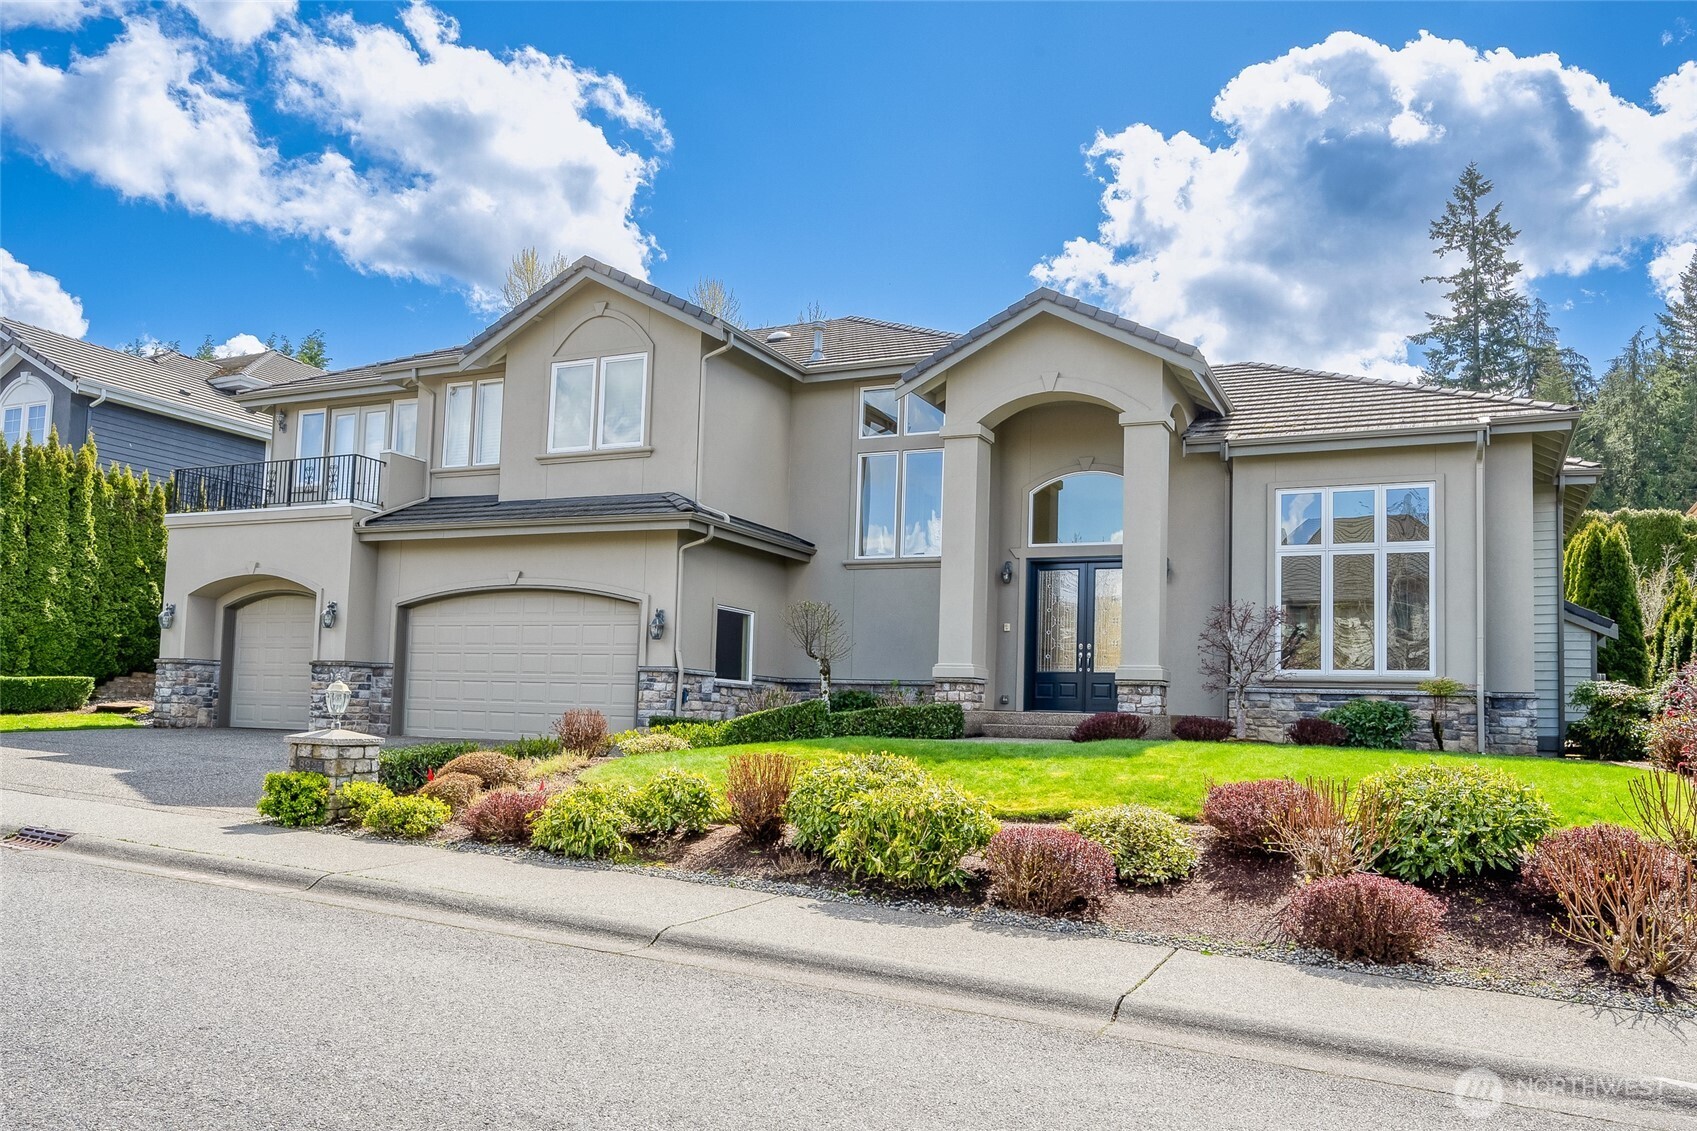
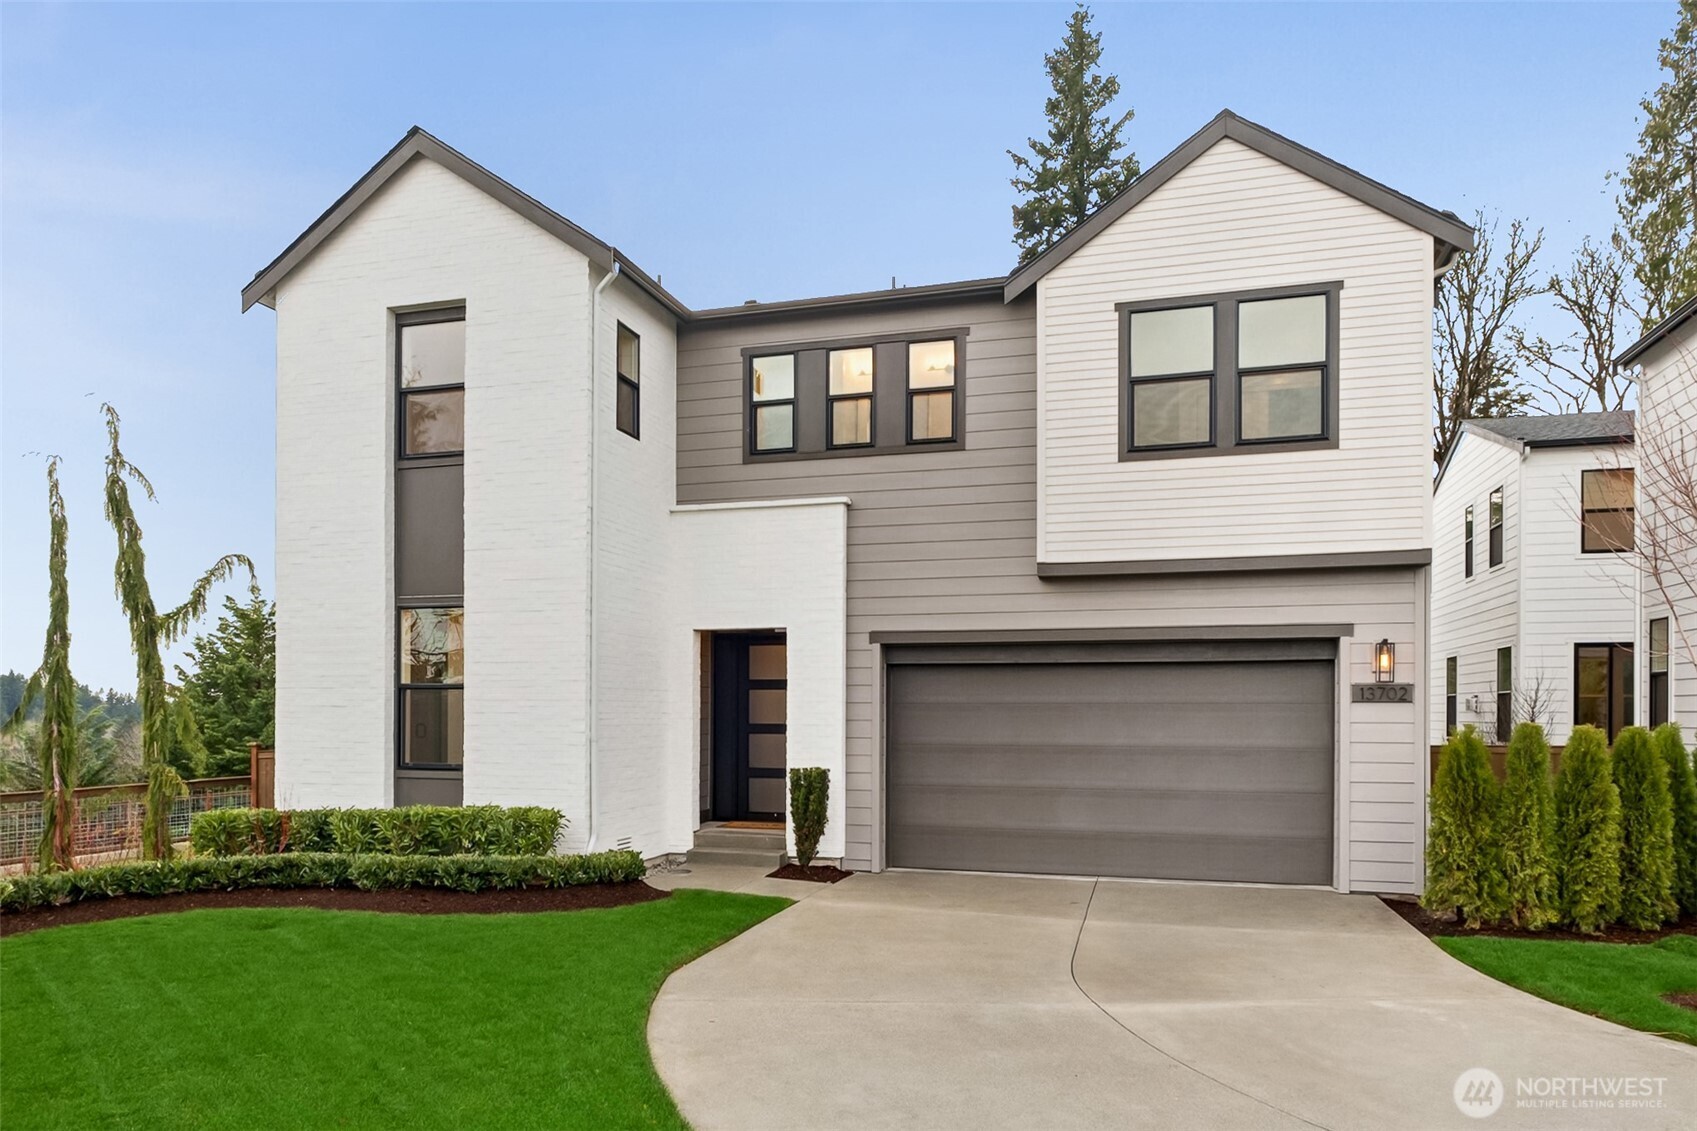
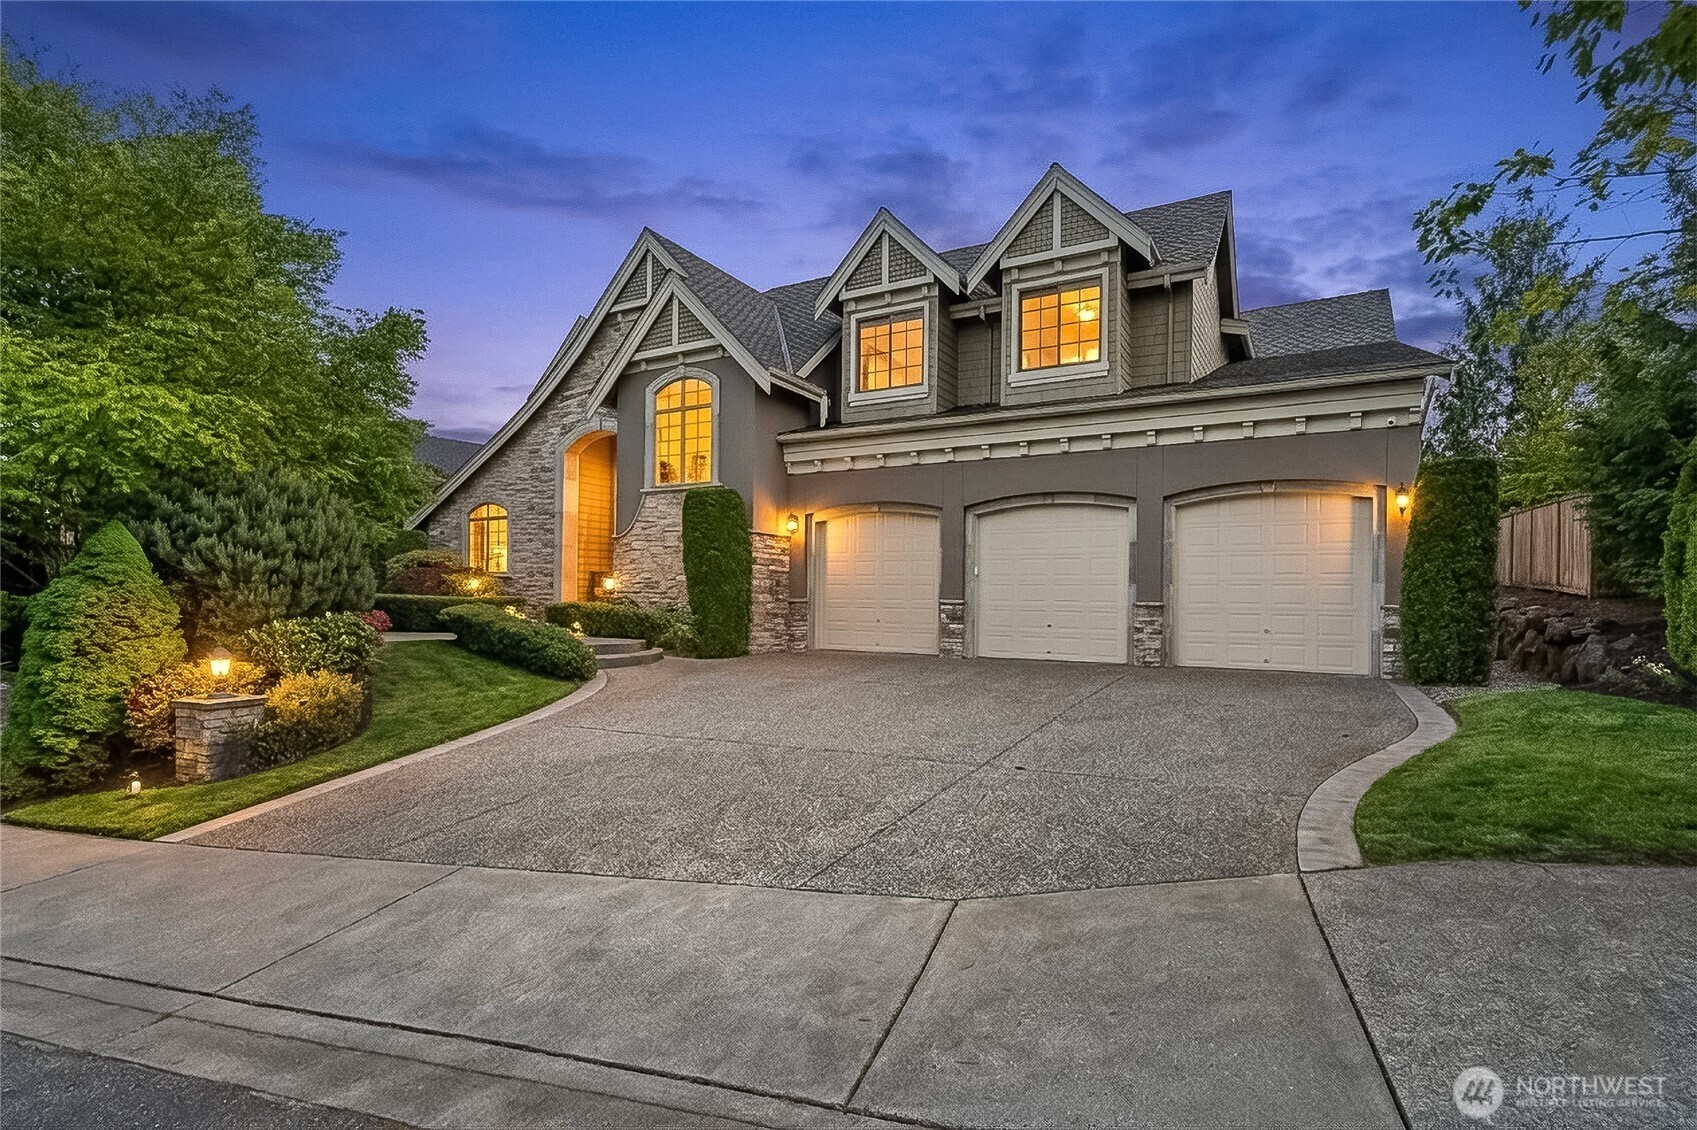
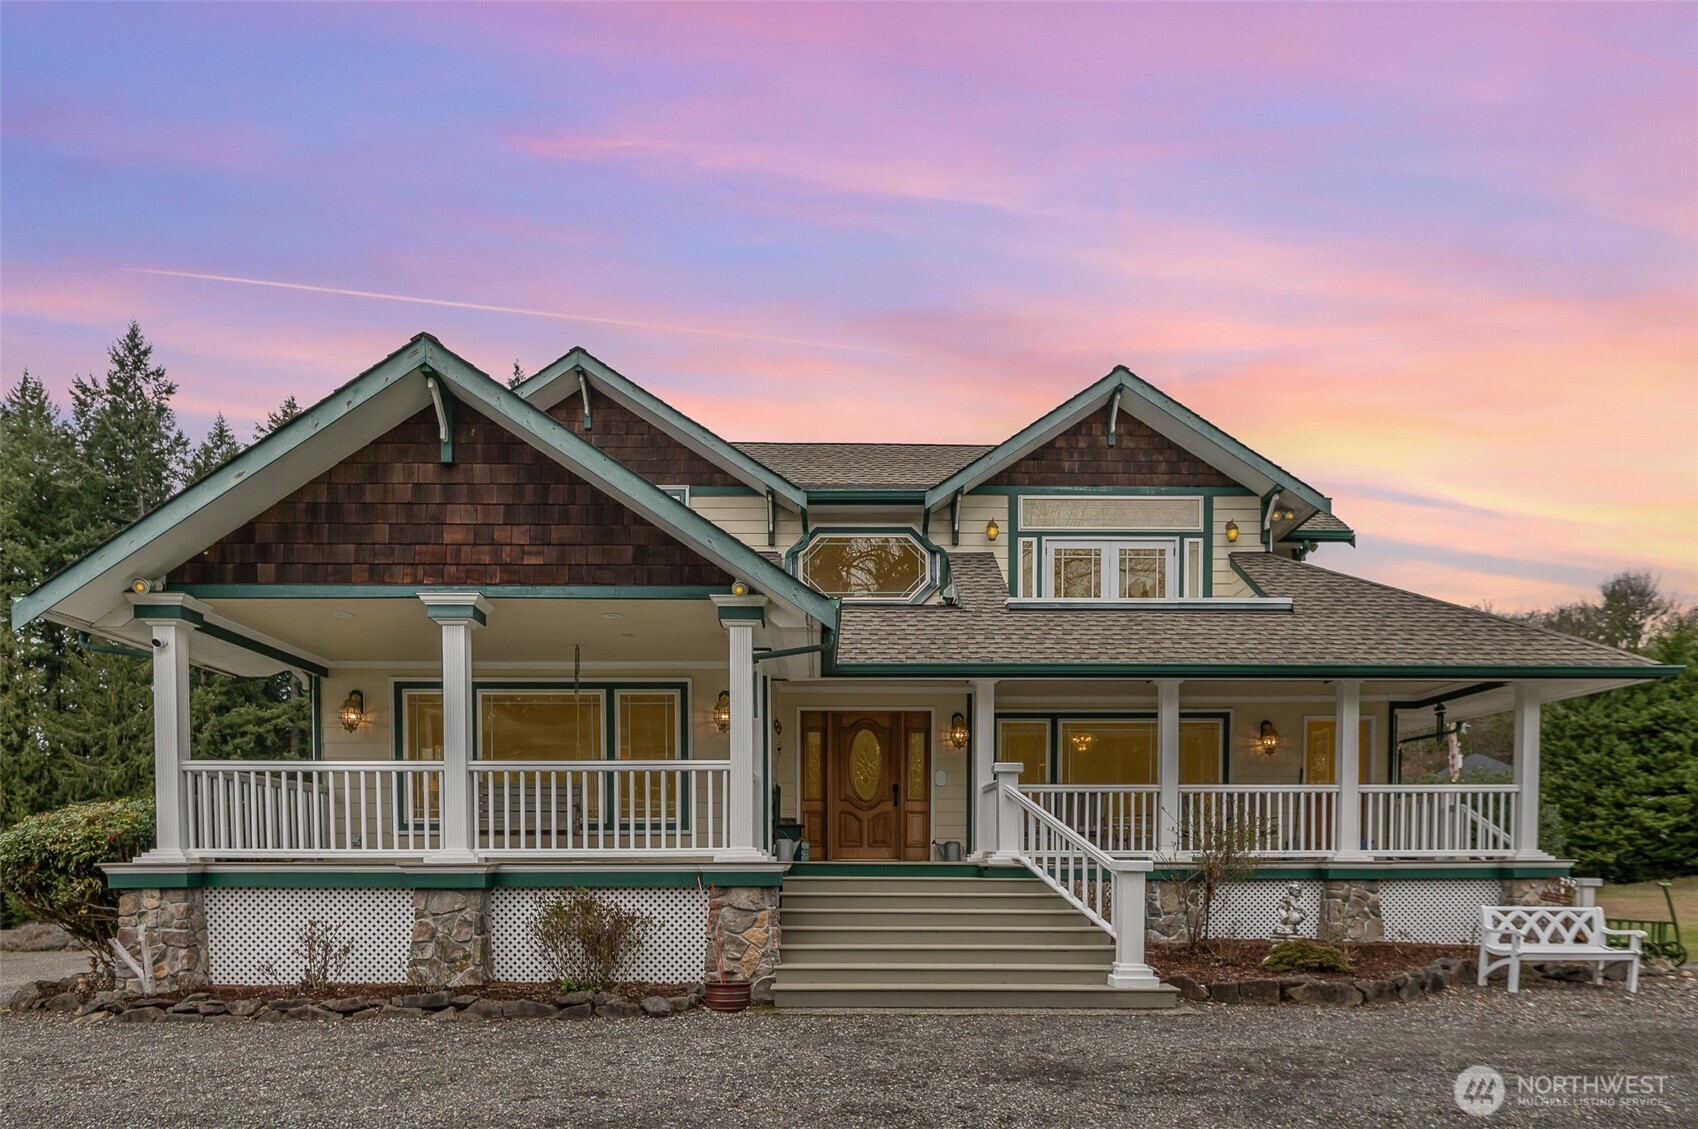
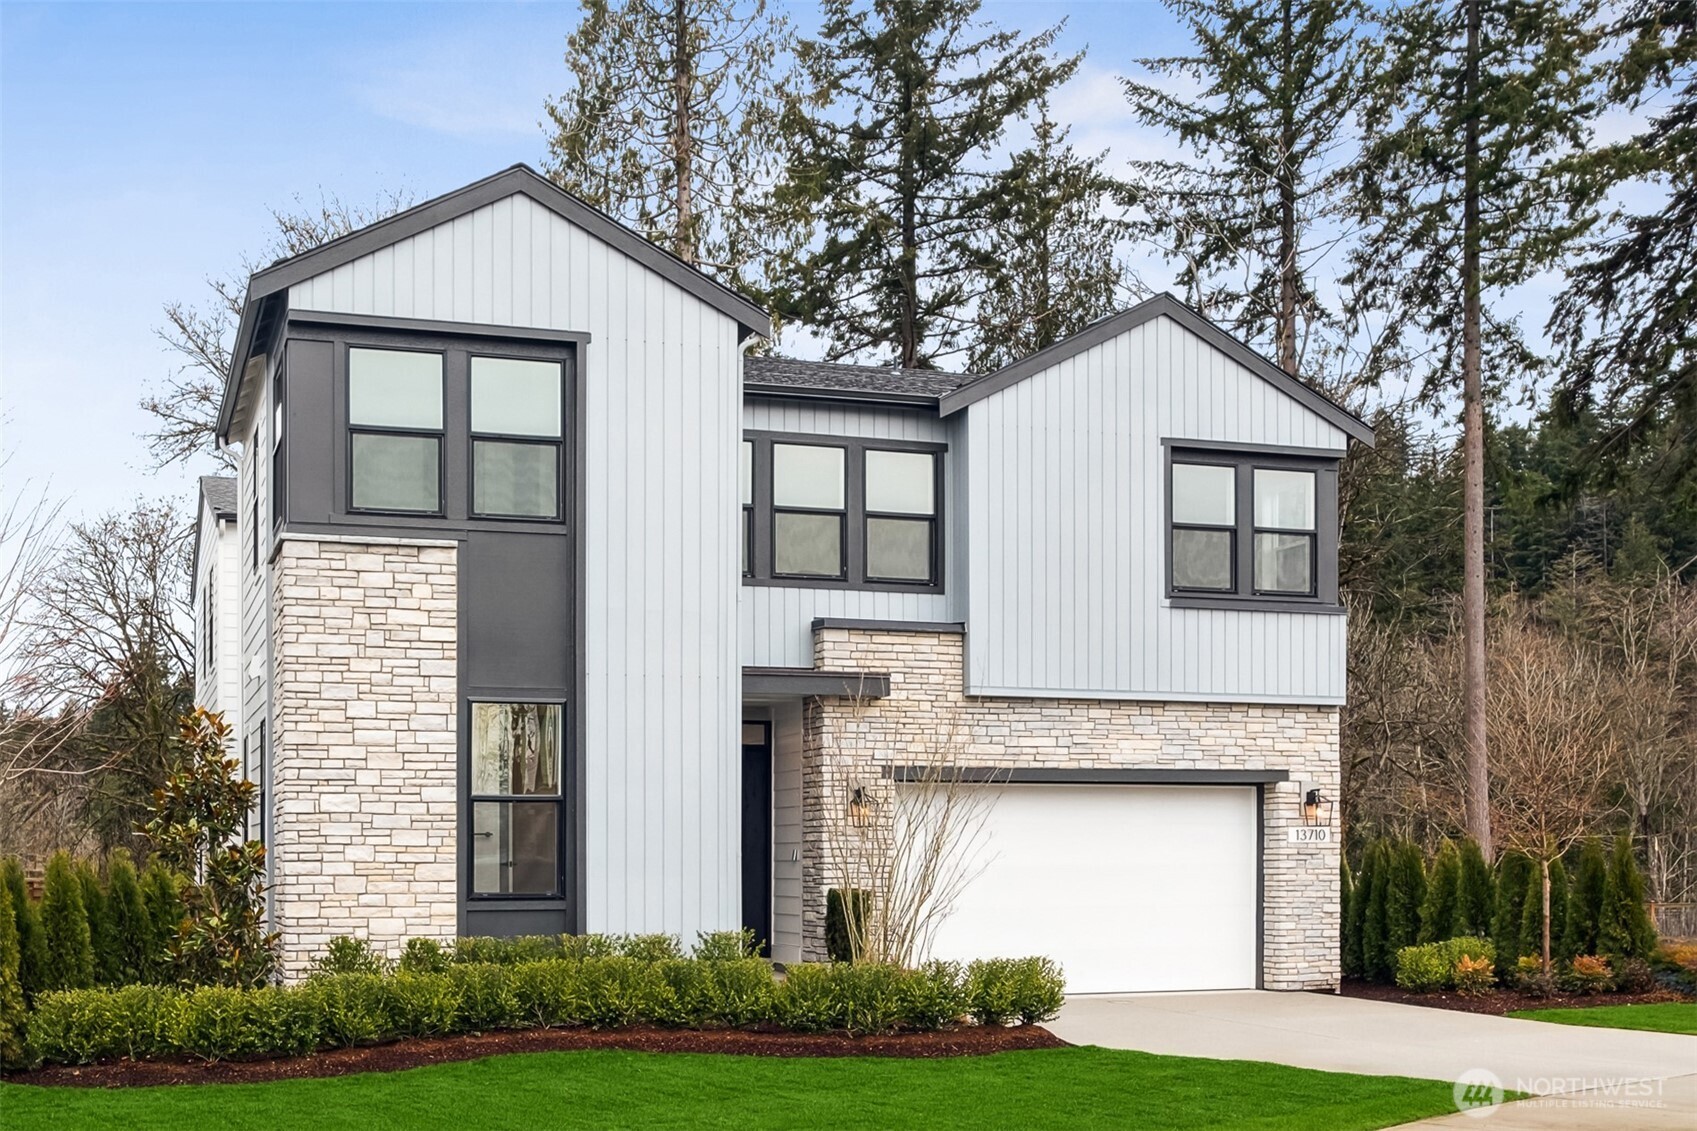
Homes in Renton include mid century single family houses, newer construction communities, townhomes, and waterfront properties along Lake Washington. Each category follows different pricing trends. A townhome near shopping and commuter routes will be valued differently than a larger single family home on a quiet residential street. Understanding the right comps is critical to determining true market value.
When evaluating a Renton CMA, recently closed sales provide the most accurate data. Active listings show seller expectations, but sold properties reveal what buyers were actually willing to pay. A proper comparative market analysis adjusts for square footage, lot size, upgrades, layout, views, and overall condition to generate a realistic property estimate.
Location factors heavily influence Renton property values. Proximity to I 405, Boeing, Bellevue, and Seattle job centers can increase demand. Homes near parks, waterfront access, schools, and retail hubs often command stronger pricing. Even small differences in neighborhood appeal or commute time can create meaningful changes in valuation.
If you are considering selling, refinancing, or simply tracking your investment, reviewing accurate local comparable sales is the most reliable starting point. PropertyEstimate.com helps homeowners determine what their home is worth in Renton WA by analyzing real market data and local trends, giving you a clearer picture of your property value and next steps.
157,493 people live in Renton, where the median age is 37.8 and the average individual income is $55,607.647. Data provided by the U.S. Census Bureau.
Total Population
Median Age
Population Density Population Density This is the number of people per square mile in a neighborhood.
Average individual Income
There's plenty to do around Renton, including shopping, dining, nightlife, parks, and more. Data provided by Walk Score and Yelp.
Explore popular things to do in the area, including Crazy Corn, 4 Sisters Holistic Remedies, and Esme' & Elodie.
| Name | Category | Distance | Reviews |
Ratings by
Yelp
|
|---|---|---|---|---|
| Dining | 4.79 miles | 23 reviews | 4.8/5 stars | |
| Dining · $$ | 2.62 miles | 96 reviews | 4.8/5 stars | |
| Shopping | 2.79 miles | 6 reviews | 5/5 stars | |
| Active | 2.04 miles | 7 reviews | 5/5 stars | |
| Beauty | 4.91 miles | 297 reviews | 4.8/5 stars | |
| Beauty | 3.71 miles | 5 reviews | 4.8/5 stars | |
| Beauty | 4.96 miles | 15 reviews | 4.7/5 stars | |
|
|
||||
|
|
||||
|
|
||||
|
|
||||
|
|
||||
|
|
Renton has 60,922 households, with an average household size of 12.46. Data provided by the U.S. Census Bureau. Here’s what the people living in Renton do for work — and how long it takes them to get there. Data provided by the U.S. Census Bureau. 157,493 people call Renton home. The population density is 3,445.396 and the largest age group is Data provided by the U.S. Census Bureau.
Total Population
Population Density Population Density This is the number of people per square mile in a neighborhood.
Median Age
Men vs Women
Population by Age Group
0-9 Years
10-17 Years
18-24 Years
25-64 Years
65-74 Years
75+ Years
Education Level
Total Households
Average Household Size
Average individual Income
Households with Children
With Children:
Without Children:
Marital Status
Blue vs White Collar Workers
Blue Collar:
White Collar:

Offering clients personalized representation, tailored marketing strategies, and premium service. Consistently surpassing expectations for buyers, sellers, and others.