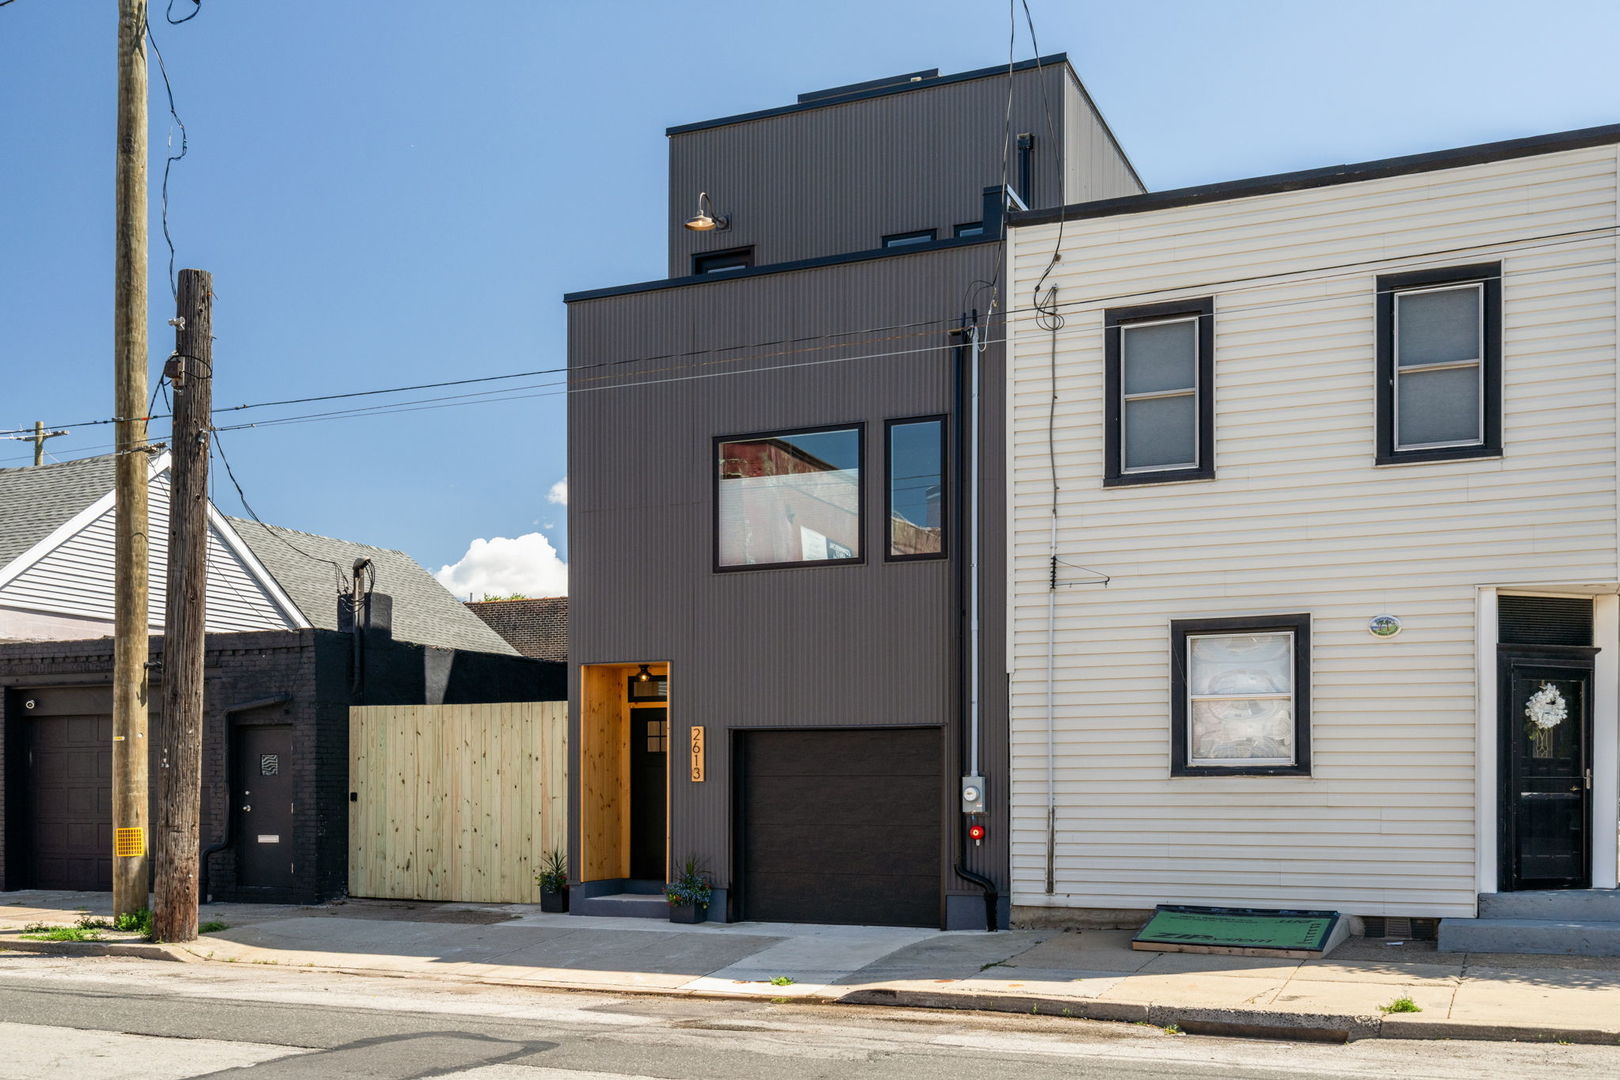
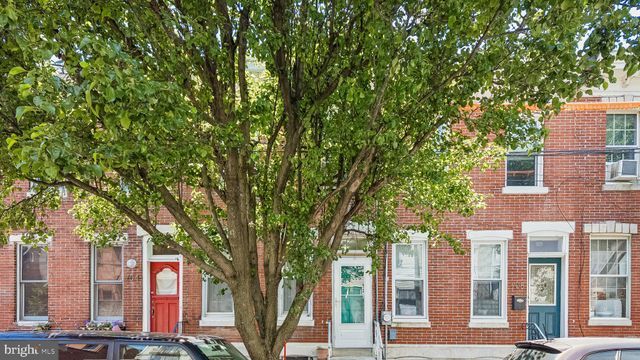
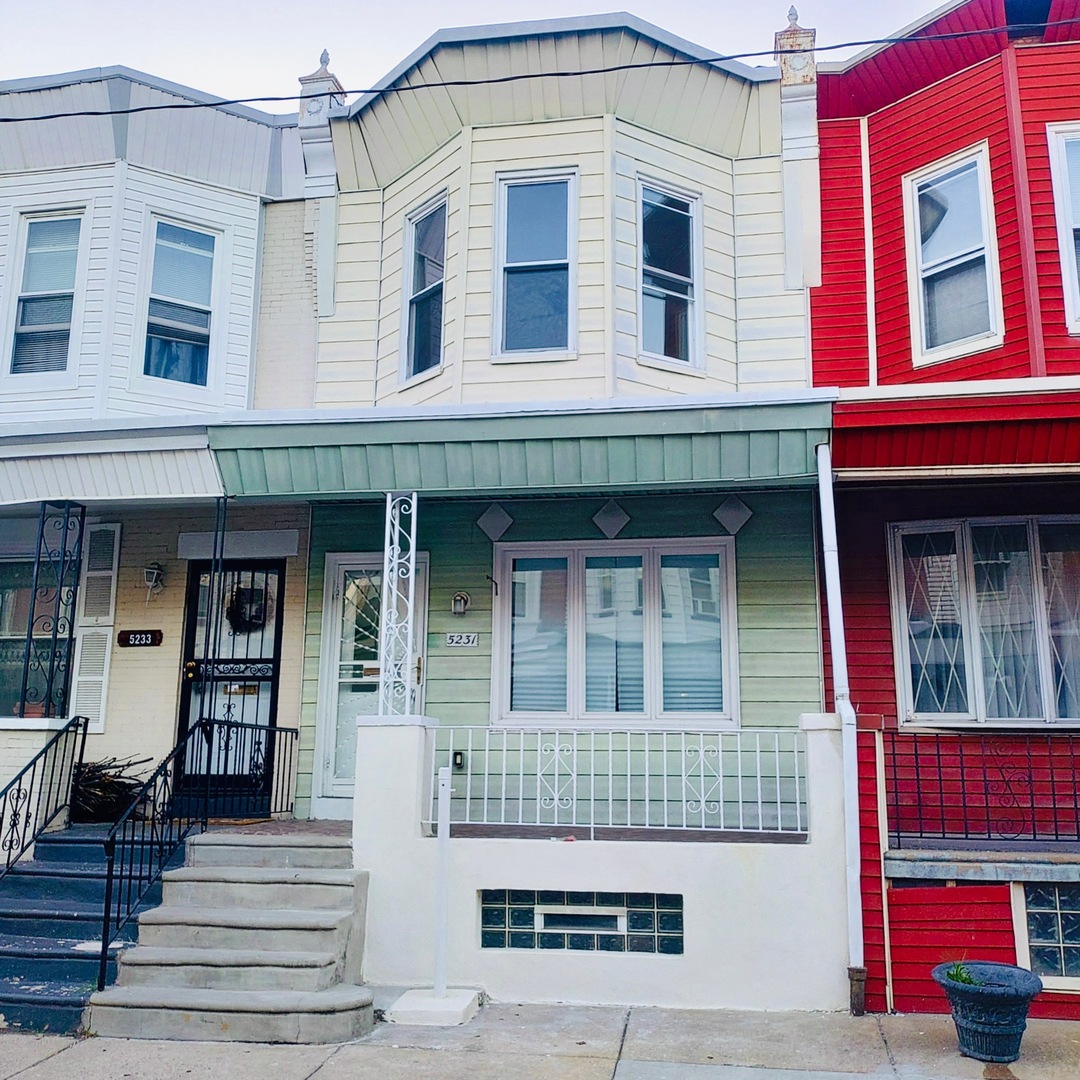
Philadelphia’s housing market is shaped by its distinct neighborhoods, historic architecture, and steady buyer demand. Property values can differ significantly between areas such as Center City, Rittenhouse Square, Fishtown, South Philadelphia, and the Main Line suburbs. Rowhomes, condos, and multifamily properties each follow different pricing patterns depending on location, condition, and proximity to transit and employment centers.
When determining what your home is worth in Philadelphia PA, recently closed sales provide the most reliable benchmark. A detailed Philadelphia CMA compares similar homes in your immediate neighborhood and adjusts for square footage, renovations, lot size, age, and overall condition. Updated kitchens, finished basements, roof condition, and outdoor space can all meaningfully impact value compared to properties needing renovation.
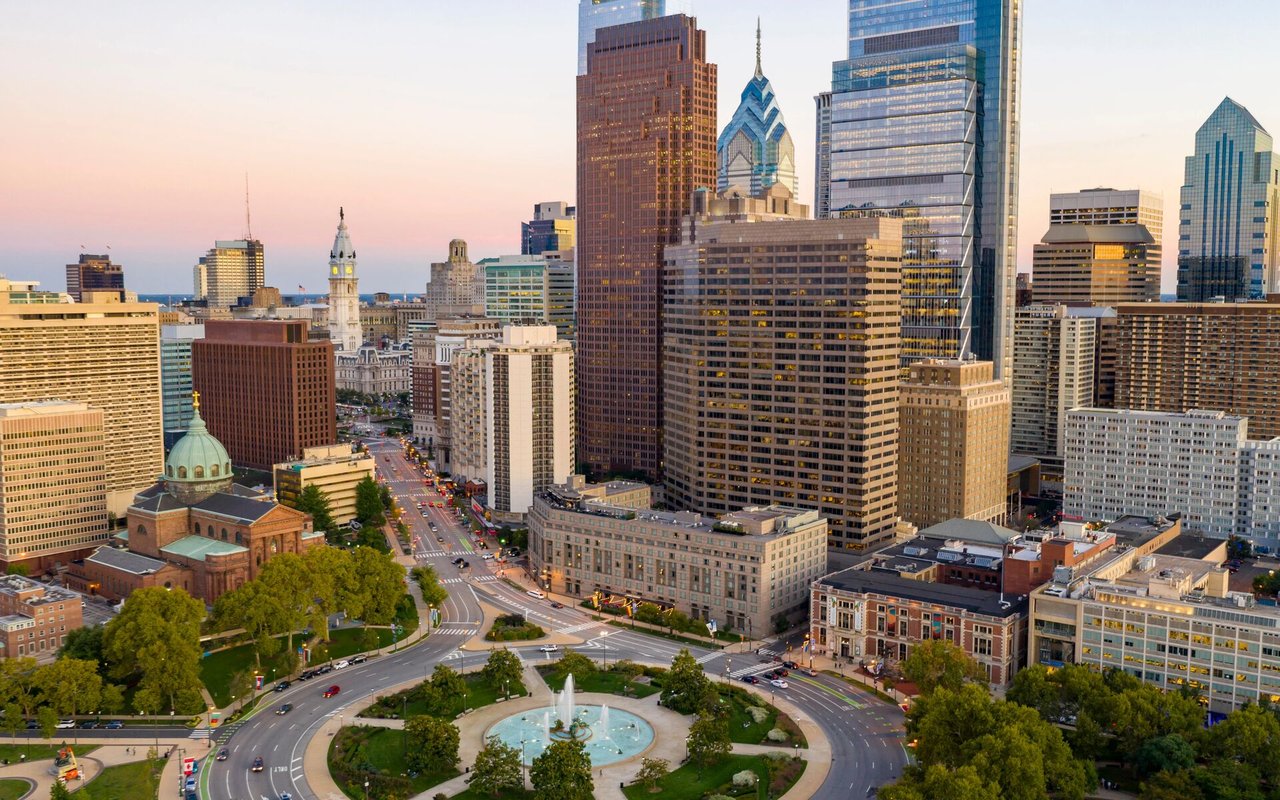
Market timing and local demand also influence pricing. Access to public transportation, walkability, school districts, and neighborhood development trends can create meaningful differences in what buyers are willing to pay. Whether you are considering selling, refinancing, or simply tracking your investment, reviewing accurate comparable sales provides a realistic understanding of your property’s position in today’s Philadelphia market.
1,582,430 people live in Philadelphia, where the median age is 35.1 and the average individual income is $37,669. Data provided by the U.S. Census Bureau.
Total Population
Median Age
Population Density Population Density This is the number of people per square mile in a neighborhood.
Average individual Income
There's plenty to do around Philadelphia, including shopping, dining, nightlife, parks, and more. Data provided by Walk Score and Yelp.
Explore popular things to do in the area, including Mayflower's Juice Bar, Champion Raste Caribbean Cuisine & Juice Bar, and Palm Tree Gourmet.
| Name | Category | Distance | Reviews |
Ratings by
Yelp
|
|---|---|---|---|---|
| Dining | 4.02 miles | 5 reviews | 4.8/5 stars | |
| Dining | 4.61 miles | 4 reviews | 5/5 stars | |
| Dining · $ | 4.73 miles | 72 reviews | 4.5/5 stars | |
| Active | 0.96 miles | 4 reviews | 5/5 stars | |
| Active | 2.8 miles | 3 reviews | 5/5 stars | |
| Active | 3.73 miles | 8 reviews | 4.5/5 stars | |
| Beauty | 3.95 miles | 4 reviews | 5/5 stars | |
| Beauty | 2.96 miles | 37 reviews | 4.6/5 stars | |
| Beauty | 3.3 miles | 3 reviews | 5/5 stars | |
| Beauty | 2.83 miles | 2 reviews | 5/5 stars | |
|
|
||||
|
|
||||
|
|
||||
|
|
||||
|
|
||||
|
|
Philadelphia has 669,222 households, with an average household size of 2.29. Data provided by the U.S. Census Bureau. Here’s what the people living in Philadelphia do for work — and how long it takes them to get there. Data provided by the U.S. Census Bureau. 1,582,430 people call Philadelphia home. The population density is 11,777.87 and the largest age group is Data provided by the U.S. Census Bureau.
Total Population
Population Density Population Density This is the number of people per square mile in a neighborhood.
Median Age
Men vs Women
Population by Age Group
0-9 Years
10-17 Years
18-24 Years
25-64 Years
65-74 Years
75+ Years
Education Level
Total Households
Average Household Size
Average individual Income
Households with Children
With Children:
Without Children:
Marital Status
Blue vs White Collar Workers
Blue Collar:
White Collar:
Offering clients personalized representation, tailored marketing strategies, and premium service. Consistently surpassing expectations for buyers, sellers, and others.