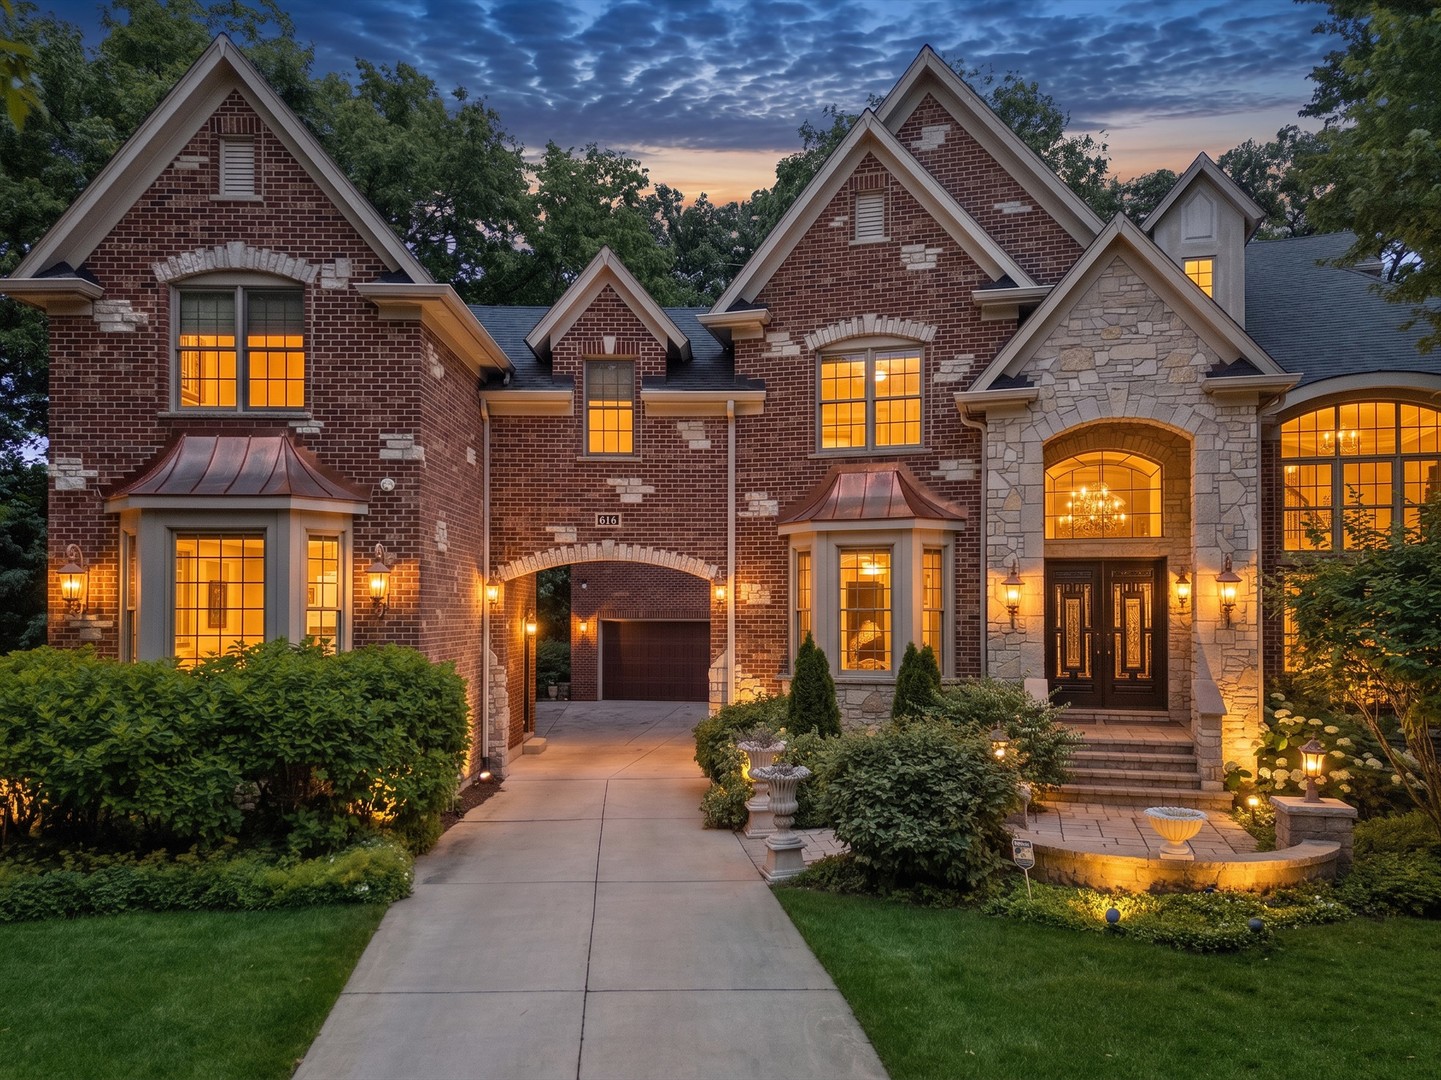
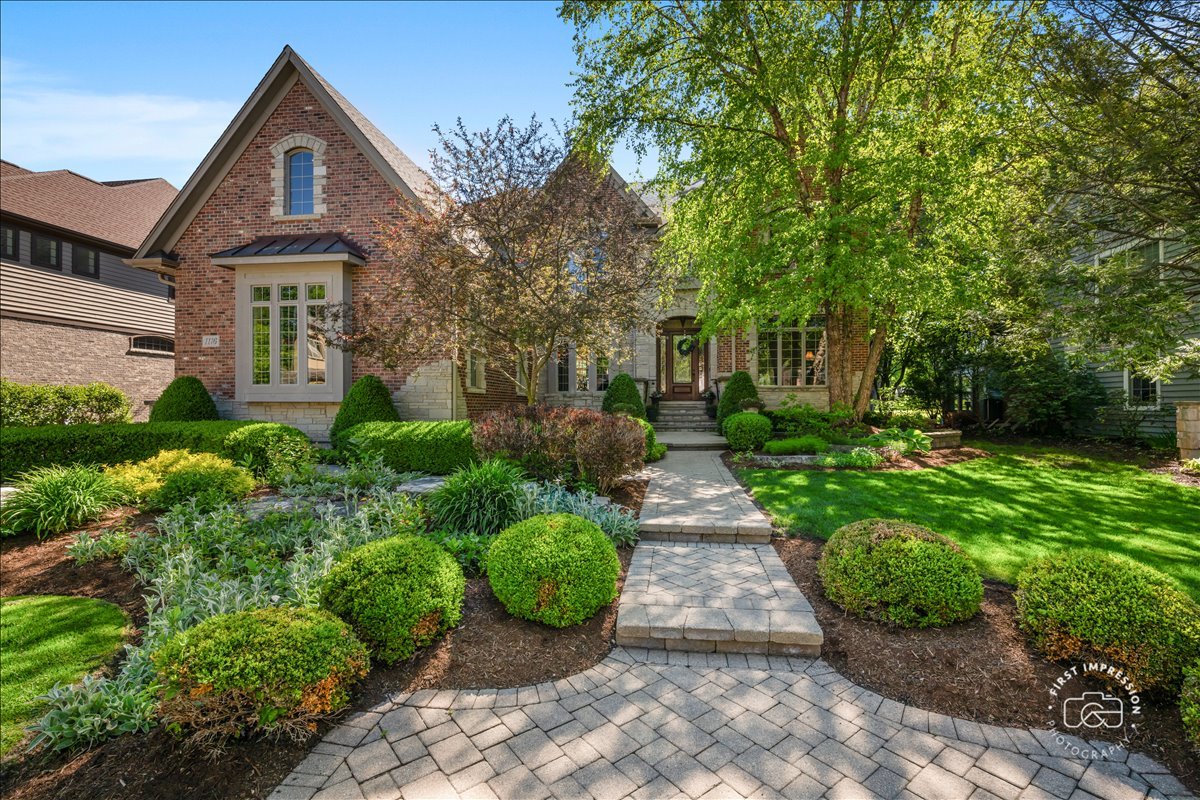
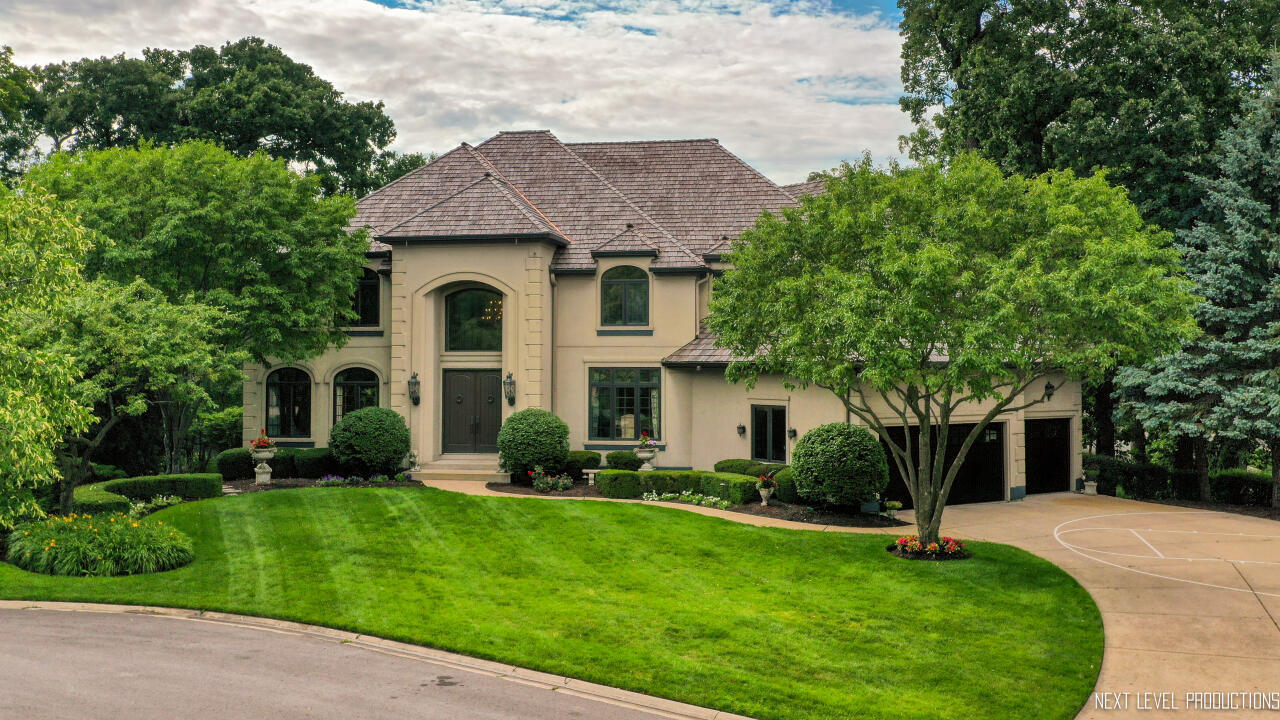
Naperville is one of the most desirable suburban housing markets in Illinois, with property values shaped heavily by school districts, neighborhood reputation, and proximity to downtown Naperville. Home prices can vary significantly between areas served by District 203 and District 204, as well as between established subdivisions and newer construction communities. Single family homes, townhomes, and luxury properties near the Riverwalk each follow different pricing trends. Walkability to downtown, access to Metra commuter rail service, nearby parks, and overall neighborhood amenities can all influence buyer demand. Updated interiors, finished basements, larger lot sizes, and modern layouts often command stronger pricing compared to properties that require renovation or modernization.
When determining what your home is worth in Naperville IL, recently closed sales provide the most accurate benchmark. A comprehensive Naperville CMA analyzes similar homes within your subdivision and adjusts for square footage, condition, upgrades, lot characteristics, and market timing. Buyer demand in Naperville tends to remain steady due to strong schools, corporate employment in the western suburbs, and consistent relocation activity. Inventory levels, interest rates, and seasonal trends can also affect pricing strategy and days on market. Whether you are preparing to sell, refinancing, or evaluating your home equity, reviewing accurate local comparable sales data is essential to understanding your property’s true market position in Naperville’s competitive suburban real estate market.
149,424 people live in Naperville, where the median age is 40.1 and the average individual income is $71,011. Data provided by the U.S. Census Bureau.
Total Population
Median Age
Population Density Population Density This is the number of people per square mile in a neighborhood.
Average individual Income
There's plenty to do around Naperville, including shopping, dining, nightlife, parks, and more. Data provided by Walk Score and Yelp.
Explore popular things to do in the area, including Yaba, Dean's Dugout, and Wolf's Crossing Community Park.
| Name | Category | Distance | Reviews |
Ratings by
Yelp
|
|---|---|---|---|---|
| Dining | 3.27 miles | 17 reviews | 4.9/5 stars | |
| Shopping | 2.19 miles | 29 reviews | 4.8/5 stars | |
| Active | 4.52 miles | 8 reviews | 5/5 stars | |
| Active | 3.11 miles | 7 reviews | 5/5 stars | |
| Active | 2.2 miles | 6 reviews | 5/5 stars | |
| Active | 1.97 miles | 5 reviews | 5/5 stars | |
| Active | 2.65 miles | 12 reviews | 4.9/5 stars | |
| Active | 2.27 miles | 40 reviews | 4.8/5 stars | |
| Active | 3.18 miles | 4 reviews | 5/5 stars | |
| Beauty | 2.96 miles | 8 reviews | 5/5 stars | |
| Beauty | 2.34 miles | 19 reviews | 5/5 stars | |
| Beauty | 3.58 miles | 17 reviews | 5/5 stars | |
| Beauty | 3.58 miles | 24 reviews | 5/5 stars | |
| Beauty | 2.17 miles | 5 reviews | 4.8/5 stars | |
|
|
||||
|
|
||||
|
|
||||
|
|
||||
|
|
||||
|
|
Naperville has 54,286 households, with an average household size of 2.71. Data provided by the U.S. Census Bureau. Here’s what the people living in Naperville do for work — and how long it takes them to get there. Data provided by the U.S. Census Bureau. 149,424 people call Naperville home. The population density is 3,821.9 and the largest age group is Data provided by the U.S. Census Bureau.
Total Population
Population Density Population Density This is the number of people per square mile in a neighborhood.
Median Age
Men vs Women
Population by Age Group
0-9 Years
10-17 Years
18-24 Years
25-64 Years
65-74 Years
75+ Years
Education Level
Total Households
Average Household Size
Average individual Income
Households with Children
With Children:
Without Children:
Marital Status
Blue vs White Collar Workers
Blue Collar:
White Collar:

Offering clients personalized representation, tailored marketing strategies, and premium service. Consistently surpassing expectations for buyers, sellers, and others.