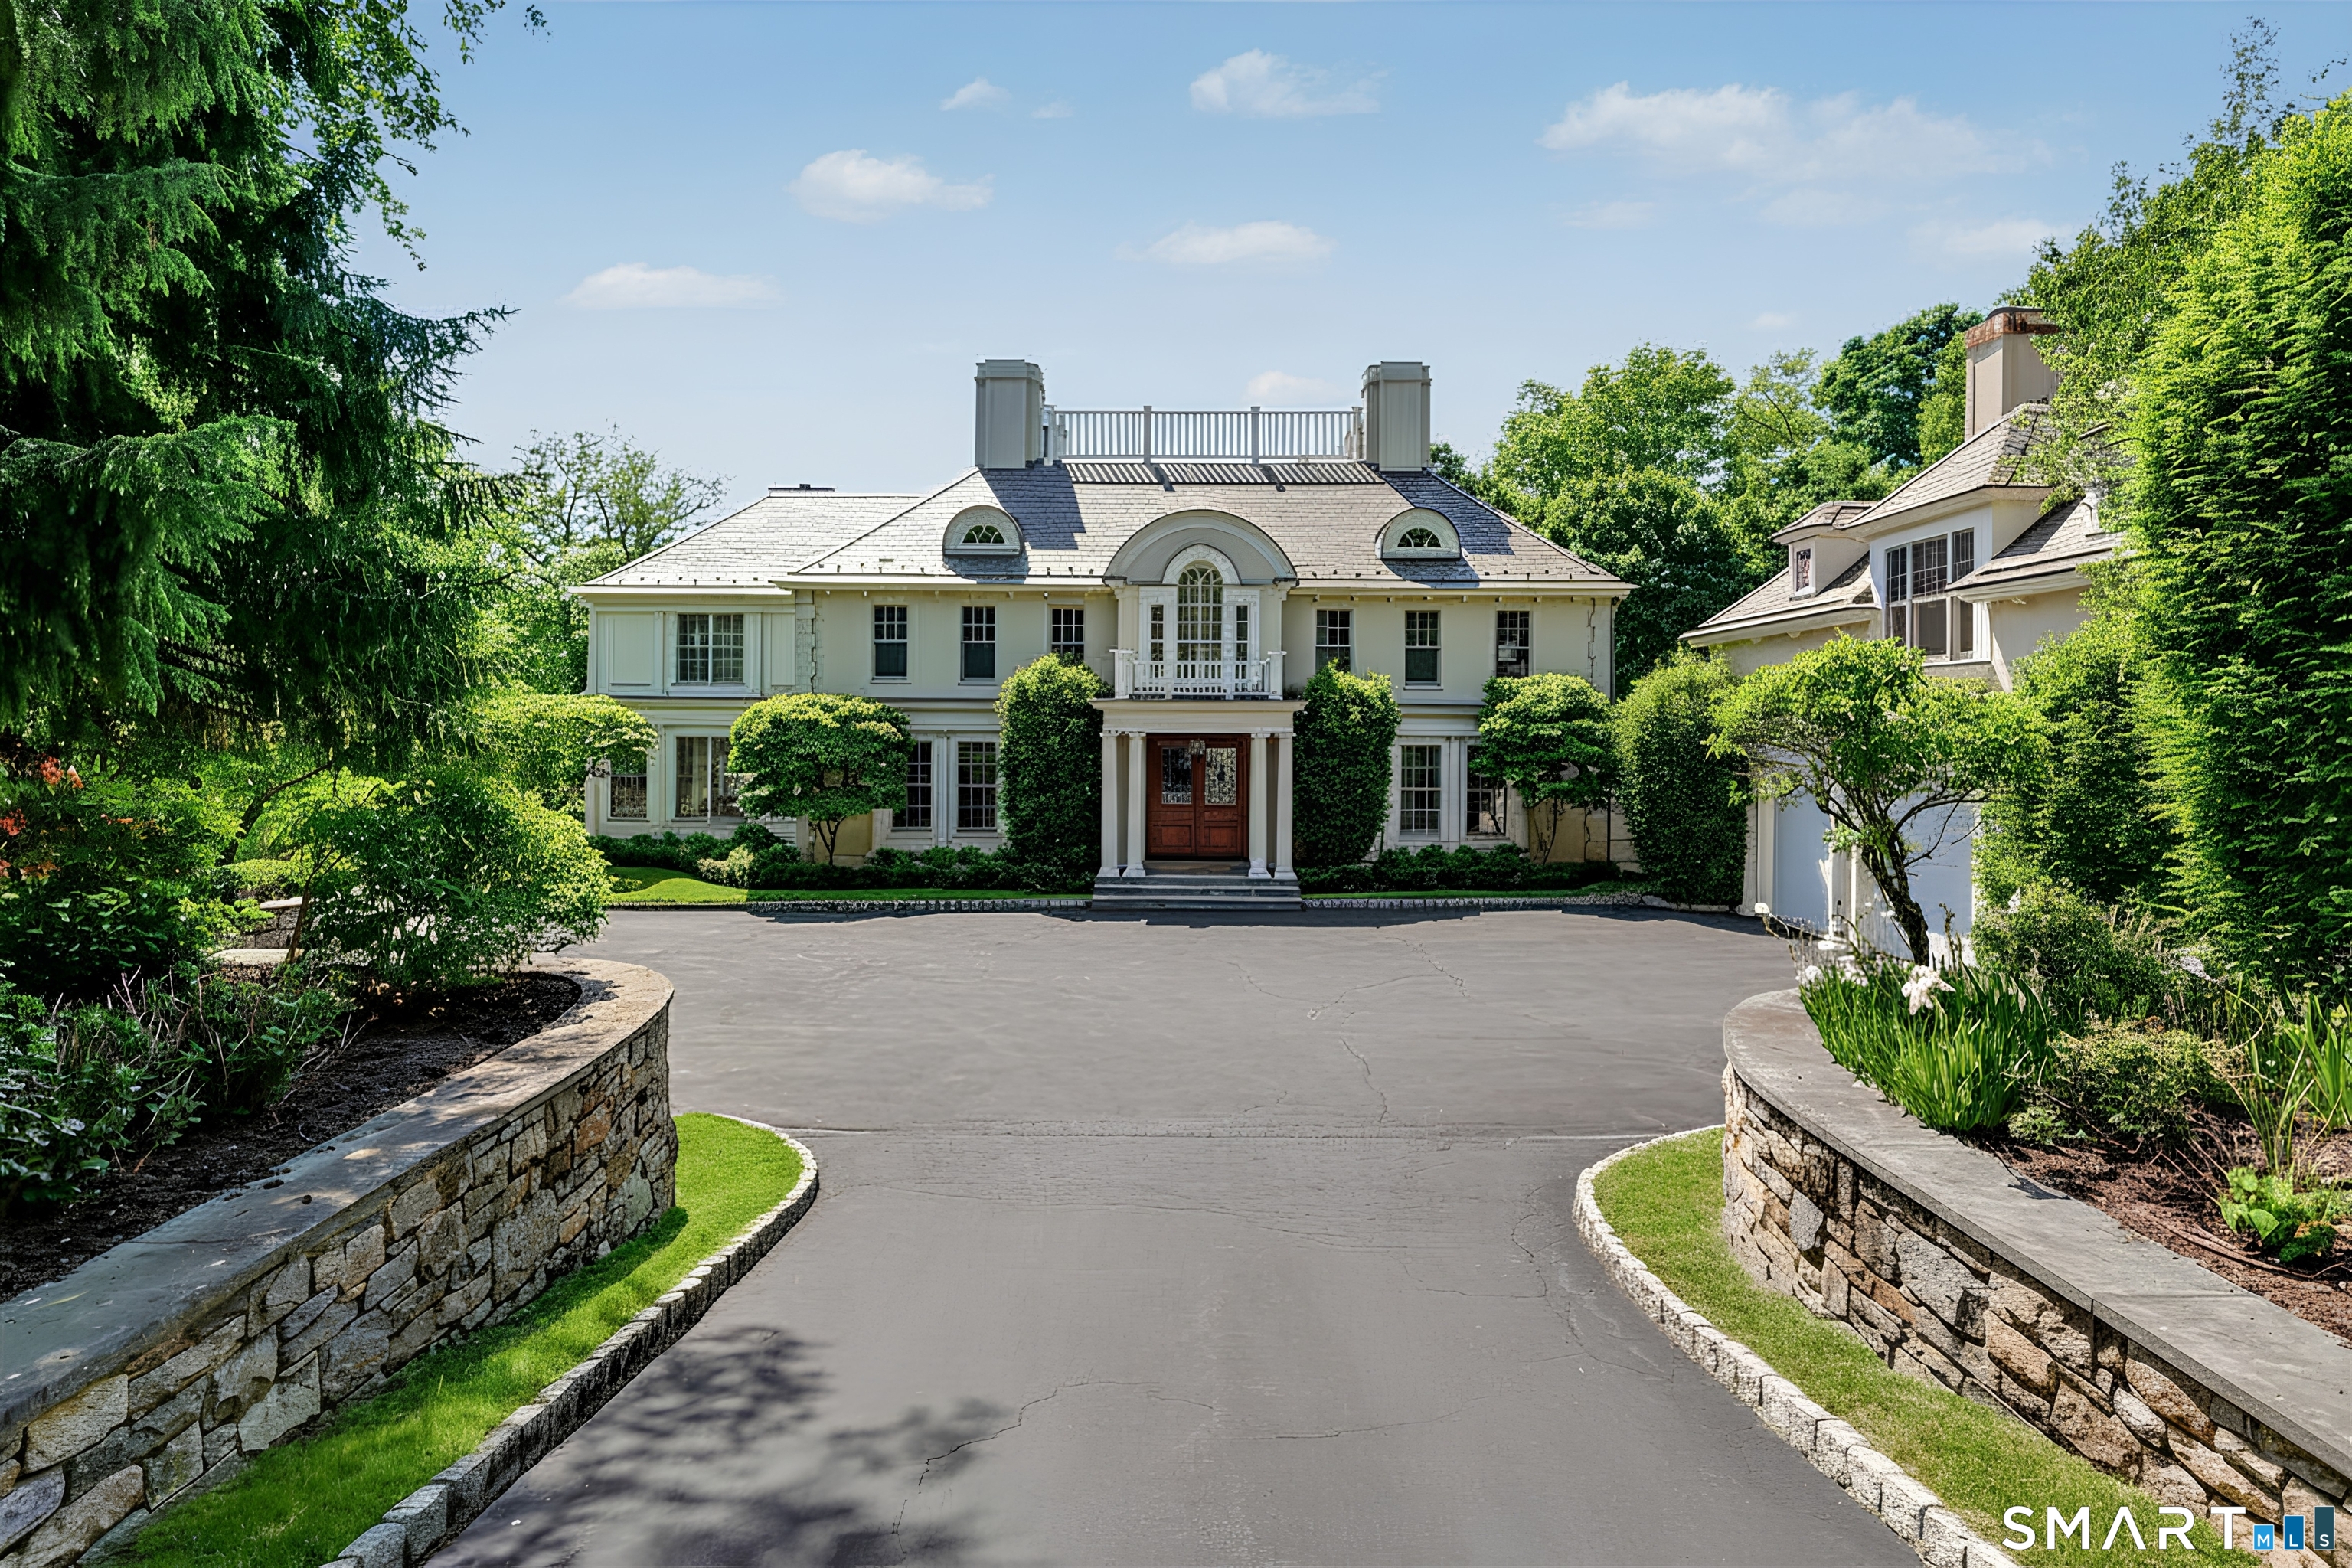
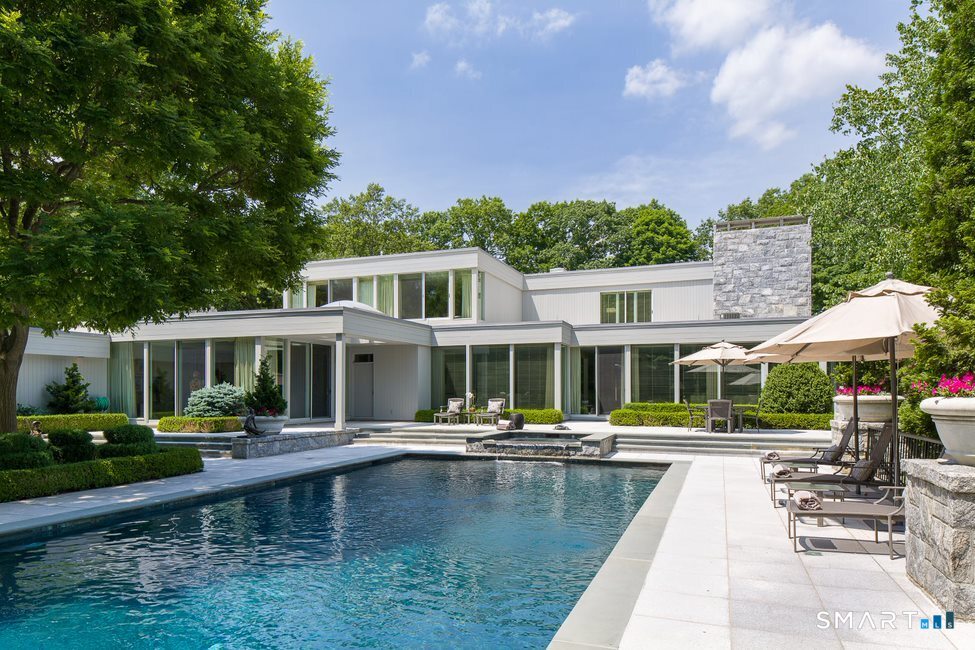
Greenwich operates in a different pricing tier than most Connecticut towns, with property values heavily influenced by estate scale, waterfront exposure, and proximity to Manhattan. Homes in backcountry Greenwich follow very different valuation patterns than properties in Old Greenwich, Riverside, or Belle Haven. In certain neighborhoods, land value alone represents a significant portion of total pricing. Estate properties often trade based on privacy, acreage, and architectural pedigree rather than basic square footage comparisons. Waterfront access, dock rights, and unobstructed Long Island Sound views can materially impact final sale prices. Luxury buyers evaluate construction quality, custom millwork, imported materials, and landscape design at a granular level. Pricing sensitivity in this segment is often tied to broader financial market performance. Demand can shift based on tax considerations and relocation patterns from New York City. New construction estates may reset expectations within specific enclaves. Determining value in Greenwich requires analysis that extends beyond standard suburban pricing models.
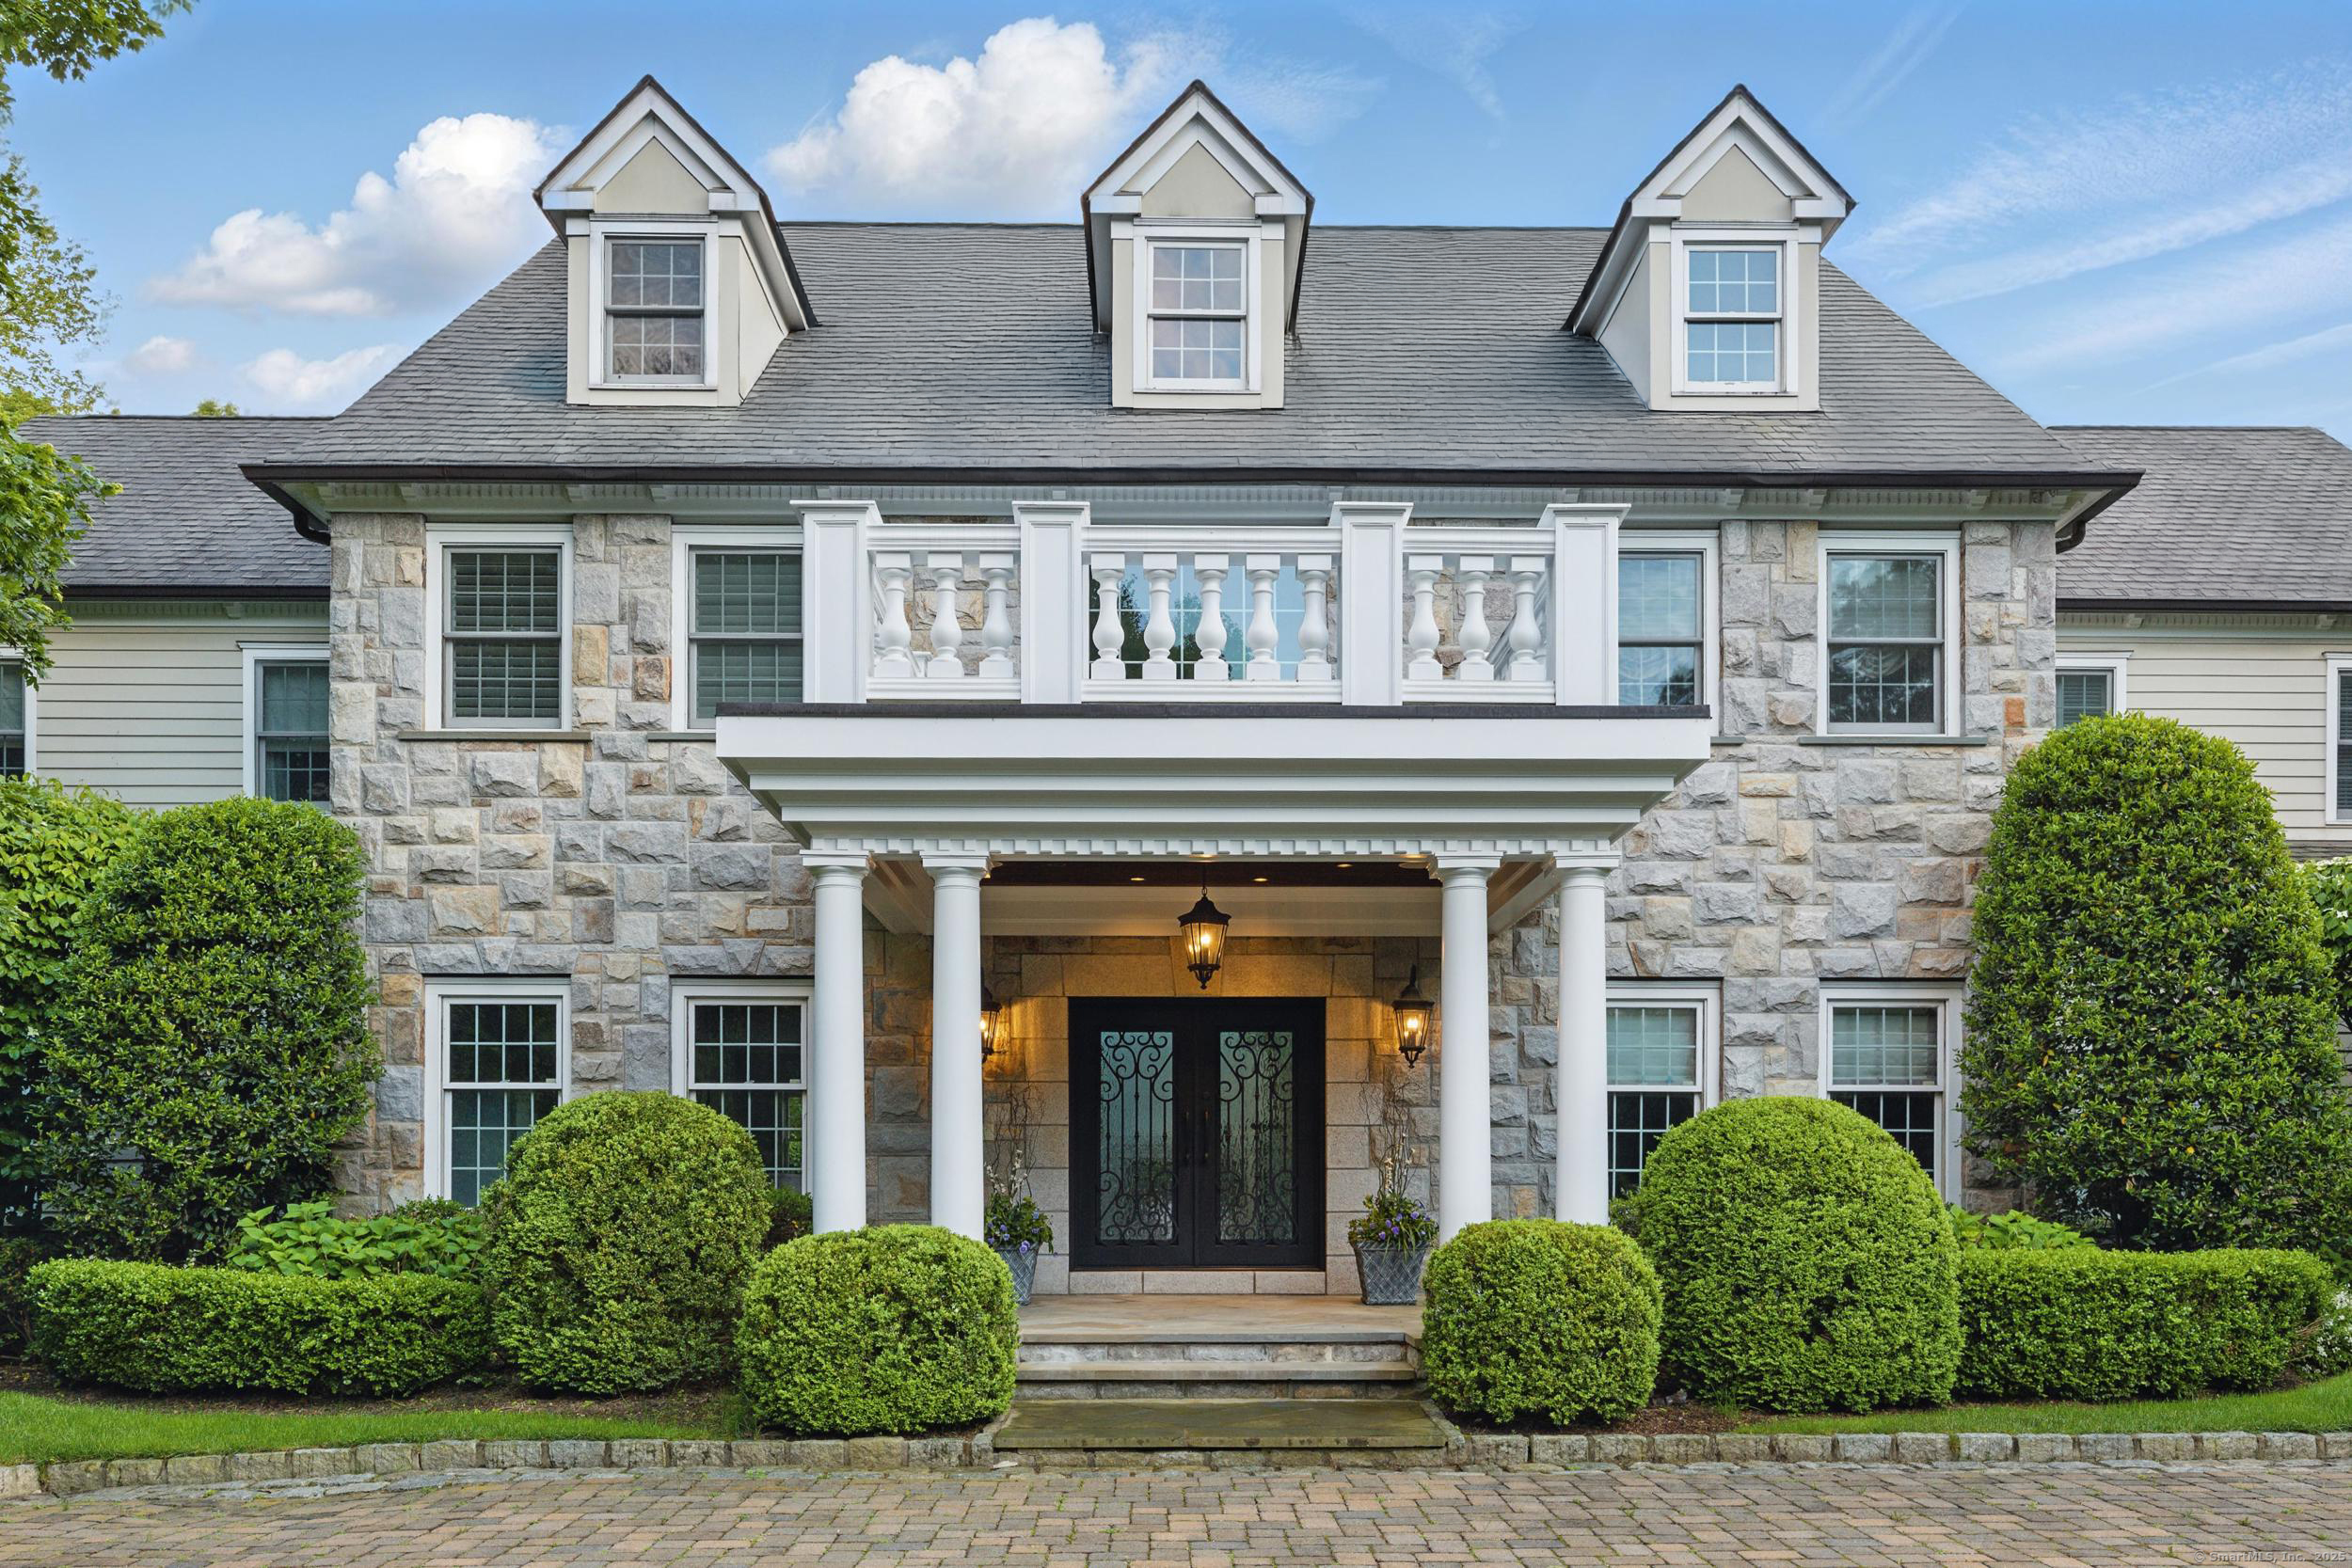
Market behavior in Greenwich tends to reflect negotiation depth rather than volume driven bidding activity. Some properties transact privately, which means public data alone may not tell the full story. Days on market can vary widely depending on price positioning and uniqueness of the home. Overpricing at the luxury level often results in extended exposure and eventual price corrections. Strategic pricing aligned with current buyer appetite is critical. Lot configuration, frontage, and setback positioning influence perception of value. Properties near the train line may command different pricing dynamics than deeper estate settings. Renovation quality can create significant valuation gaps even among similarly sized homes. Seasonal activity may influence showing traffic but not necessarily ultimate pricing power. A thorough Greenwich valuation requires nuanced understanding of micro market behavior within each distinct neighborhood pocket.
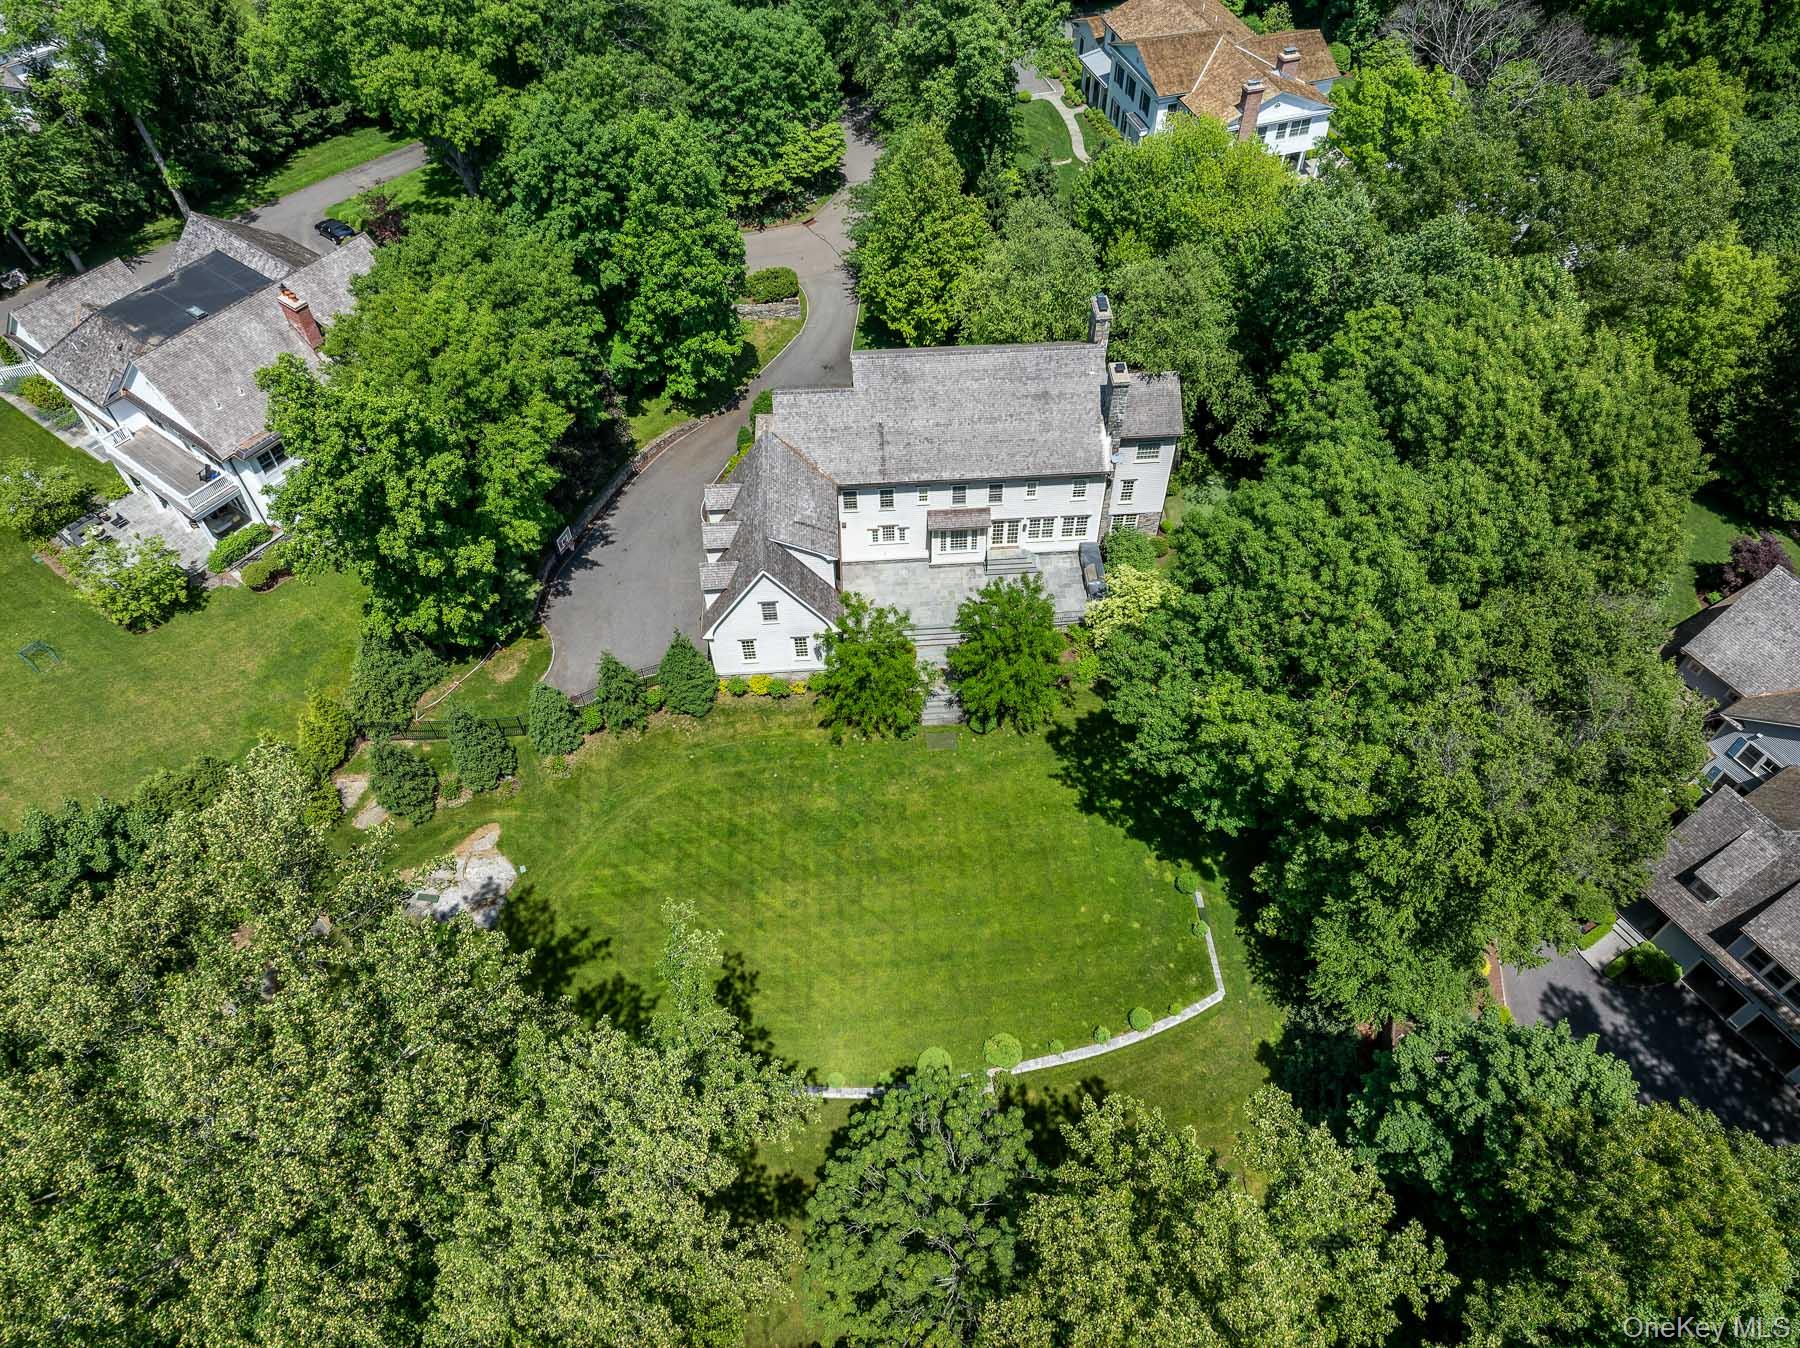
Greenwich continues to attract high net worth buyers seeking proximity to New York City while maintaining privacy and estate living. Infrastructure, shoreline preservation, and zoning regulations influence long term property positioning. Buyers in this market segment often compare Greenwich to Westchester County and luxury enclaves in other Northeast markets. Pricing strategy must account for both local supply and broader economic sentiment. Ultra high end inventory may move differently than mid luxury price points. Off market activity can sometimes reduce visible competition. Sellers benefit from understanding current buyer motivations before entering the market. Accurate valuation protects against both underselling and stagnation. Whether evaluating equity, planning a sale, or assessing investment positioning, clarity in pricing methodology is essential. A Greenwich focused valuation approach grounded in real time luxury market insight provides a far more accurate estimate than automated pricing tools.
39,575 people live in Greenwich, where the median age is 45.1 and the average individual income is $132,738.093. Data provided by the U.S. Census Bureau.
Total Population
Median Age
Population Density Population Density This is the number of people per square mile in a neighborhood.
Average individual Income
There's plenty to do around Greenwich, including shopping, dining, nightlife, parks, and more. Data provided by Walk Score and Yelp.
Greenwich has 14,638 households, with an average household size of 5.39. Data provided by the U.S. Census Bureau. Here’s what the people living in Greenwich do for work — and how long it takes them to get there. Data provided by the U.S. Census Bureau. 39,575 people call Greenwich home. The population density is 1,356.026 and the largest age group is Data provided by the U.S. Census Bureau.
Total Population
Population Density Population Density This is the number of people per square mile in a neighborhood.
Median Age
Men vs Women
Population by Age Group
0-9 Years
10-17 Years
18-24 Years
25-64 Years
65-74 Years
75+ Years
Education Level
Total Households
Average Household Size
Average individual Income
Households with Children
With Children:
Without Children:
Marital Status
Blue vs White Collar Workers
Blue Collar:
White Collar:
Offering clients personalized representation, tailored marketing strategies, and premium service. Consistently surpassing expectations for buyers, sellers, and others.