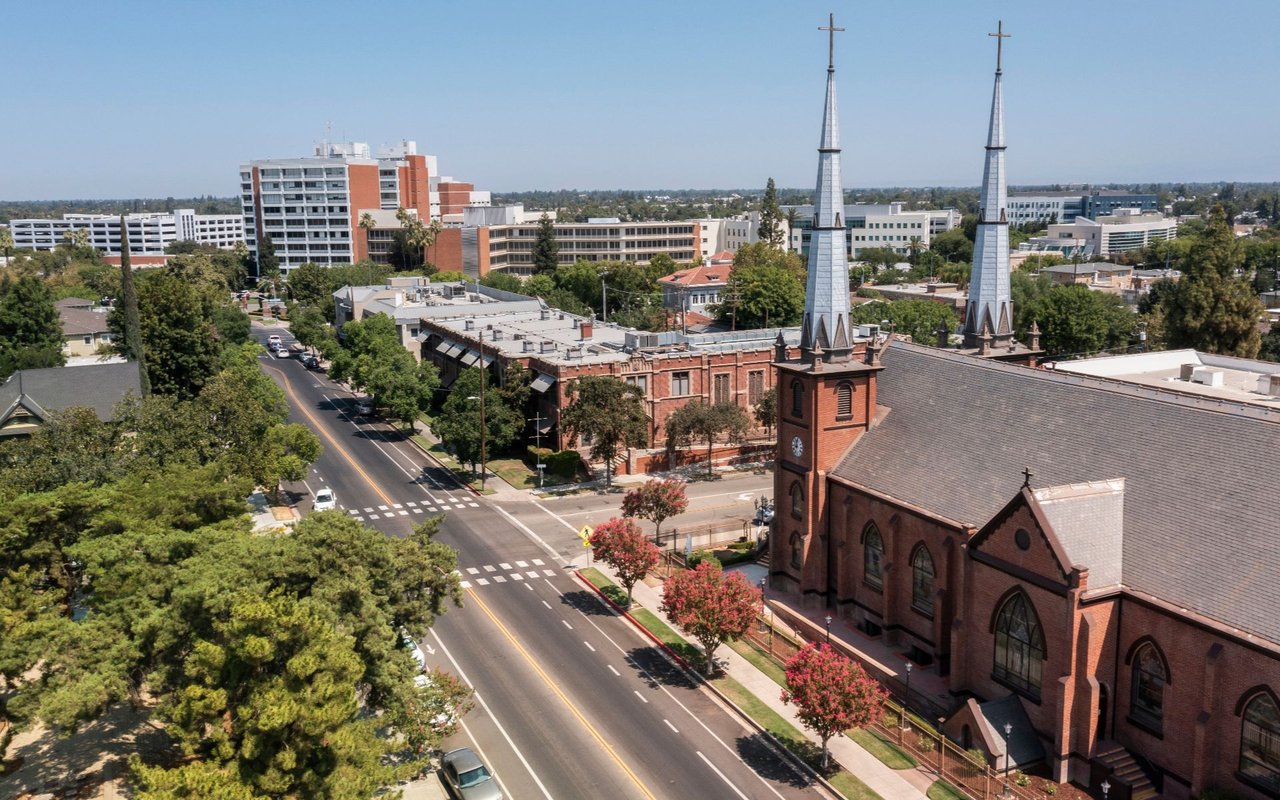
Fresno’s housing market is shaped by affordability, agricultural economy influence, and steady Central Valley population growth. Property values can vary significantly between North Fresno, Clovis border areas, Tower District, and neighborhoods closer to downtown. Homes near highly rated school zones often operate within a different pricing tier than other sections of the city. Single family residences represent the majority of market activity. Newer construction subdivisions follow different valuation patterns than established neighborhoods. Proximity to major commuter routes and employment centers can influence buyer demand. Updated interiors and energy efficient improvements may strengthen competitive positioning. Lot size and neighborhood setting often impact perceived value. Inventory levels may tighten during peak spring and summer seasons. Determining accurate value in Fresno requires analyzing neighborhood specific sales rather than relying on broader county averages.
Buyer behavior in Fresno often reflects price sensitivity relative to higher cost California markets. Many buyers relocating from coastal areas compare pricing to what similar budgets would buy in Los Angeles or the Bay Area. Homes priced in line with recent local activity may attract steady showing traffic. Overpricing can quickly reduce interest in competitive segments. Properties requiring renovation often trade below updated comparables within the same neighborhood. Investor participation may influence demand in entry level price ranges. Days on market trends help signal alignment with buyer appetite. Interest rate movement can impact qualification ranges and affordability. New development in surrounding communities may shift competitive positioning. A localized pricing review provides clearer guidance than automated valuation tools.
Fresno continues to benefit from regional population growth and relative affordability within California. Buyers often evaluate value based on home size and lot space compared to coastal cities. Infrastructure improvements and commercial development may influence long term appreciation. Strategic pricing improves the likelihood of attracting qualified buyers efficiently. Micro market differences can exist even within the same zip code. Market pace may shift depending on inventory supply and broader economic conditions. Proper preparation strengthens overall listing performance. Understanding neighborhood level demand enhances negotiation outcomes. Whether preparing to sell or reviewing equity, accurate valuation analysis is essential. A Fresno focused home value assessment grounded in current neighborhood performance provides dependable pricing clarity.
613,061 people live in Fresno, where the median age is 33 and the average individual income is $31,741.533. Data provided by the U.S. Census Bureau.
Total Population
Median Age
Population Density Population Density This is the number of people per square mile in a neighborhood.
Average individual Income
There's plenty to do around Fresno, including shopping, dining, nightlife, parks, and more. Data provided by Walk Score and Yelp.
Explore popular things to do in the area, including Taconazo, Mr Mango, and Vanntastic Sweets.
| Name | Category | Distance | Reviews |
Ratings by
Yelp
|
|---|---|---|---|---|
| Dining · $ | 3.64 miles | 28 reviews | 4.9/5 stars | |
| Dining | 4.45 miles | 9 reviews | 4.9/5 stars | |
| Dining | 3.32 miles | 21 reviews | 4.8/5 stars | |
| Beauty | 3.38 miles | 5 reviews | 5/5 stars | |
| Beauty | 4.02 miles | 14 reviews | 5/5 stars | |
| Beauty | 3.26 miles | 11 reviews | 5/5 stars | |
| Beauty | 4.46 miles | 21 reviews | 4.8/5 stars | |
| Beauty | 3.46 miles | 4 reviews | 5/5 stars | |
|
|
||||
|
|
||||
|
|
||||
|
|
||||
|
|
||||
|
|
Fresno has 201,413 households, with an average household size of 53.34. Data provided by the U.S. Census Bureau. Here’s what the people living in Fresno do for work — and how long it takes them to get there. Data provided by the U.S. Census Bureau. 613,061 people call Fresno home. The population density is 4,741.613 and the largest age group is Data provided by the U.S. Census Bureau.
Total Population
Population Density Population Density This is the number of people per square mile in a neighborhood.
Median Age
Men vs Women
Population by Age Group
0-9 Years
10-17 Years
18-24 Years
25-64 Years
65-74 Years
75+ Years
Education Level
Total Households
Average Household Size
Average individual Income
Households with Children
With Children:
Without Children:
Marital Status
Blue vs White Collar Workers
Blue Collar:
White Collar:
Offering clients personalized representation, tailored marketing strategies, and premium service. Consistently surpassing expectations for buyers, sellers, and others.