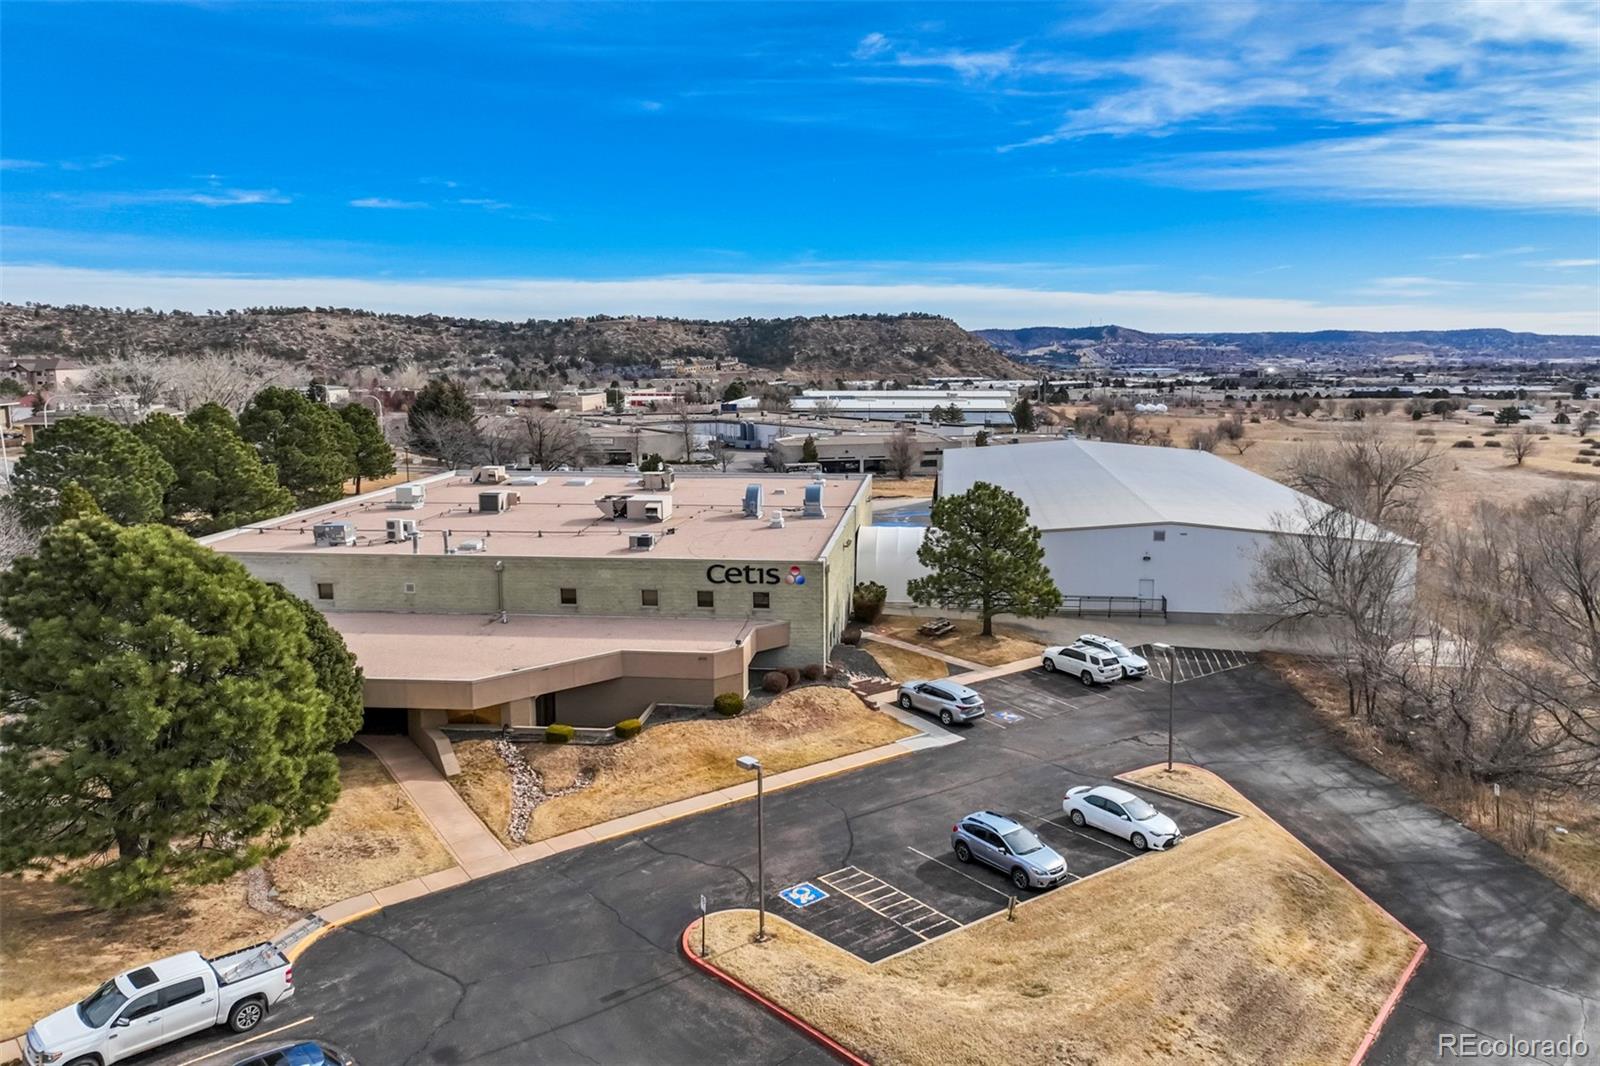
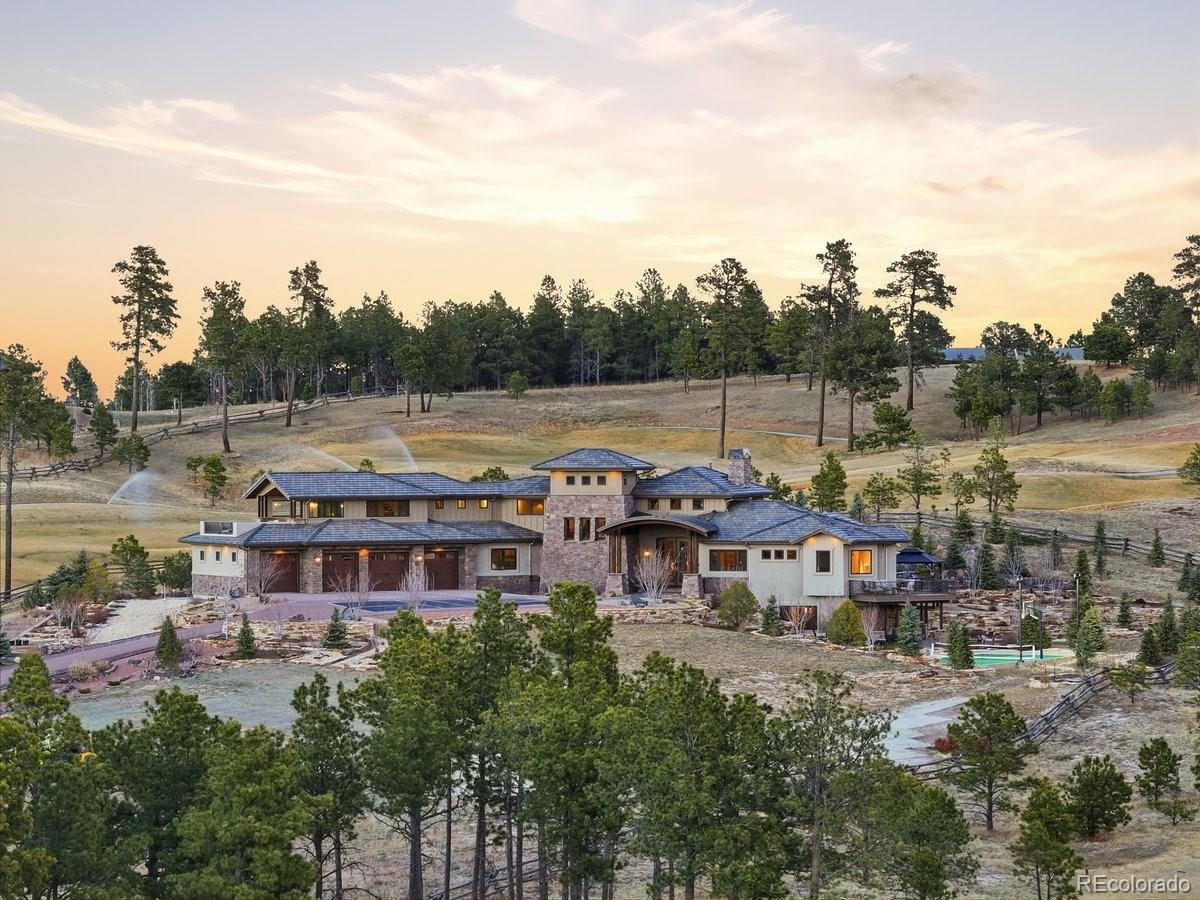
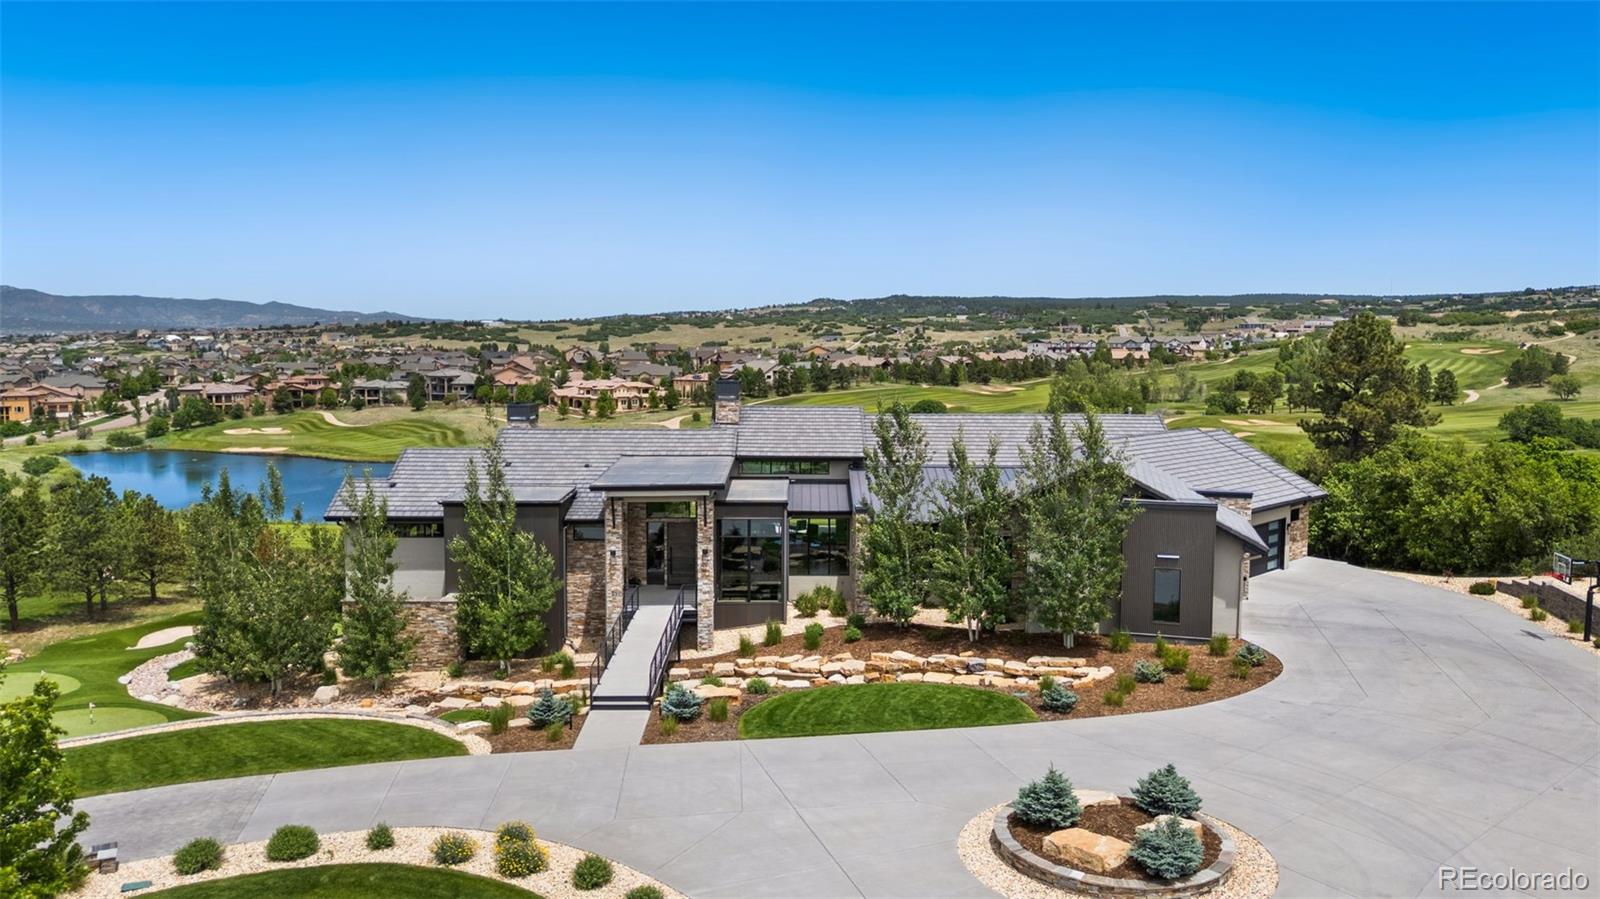
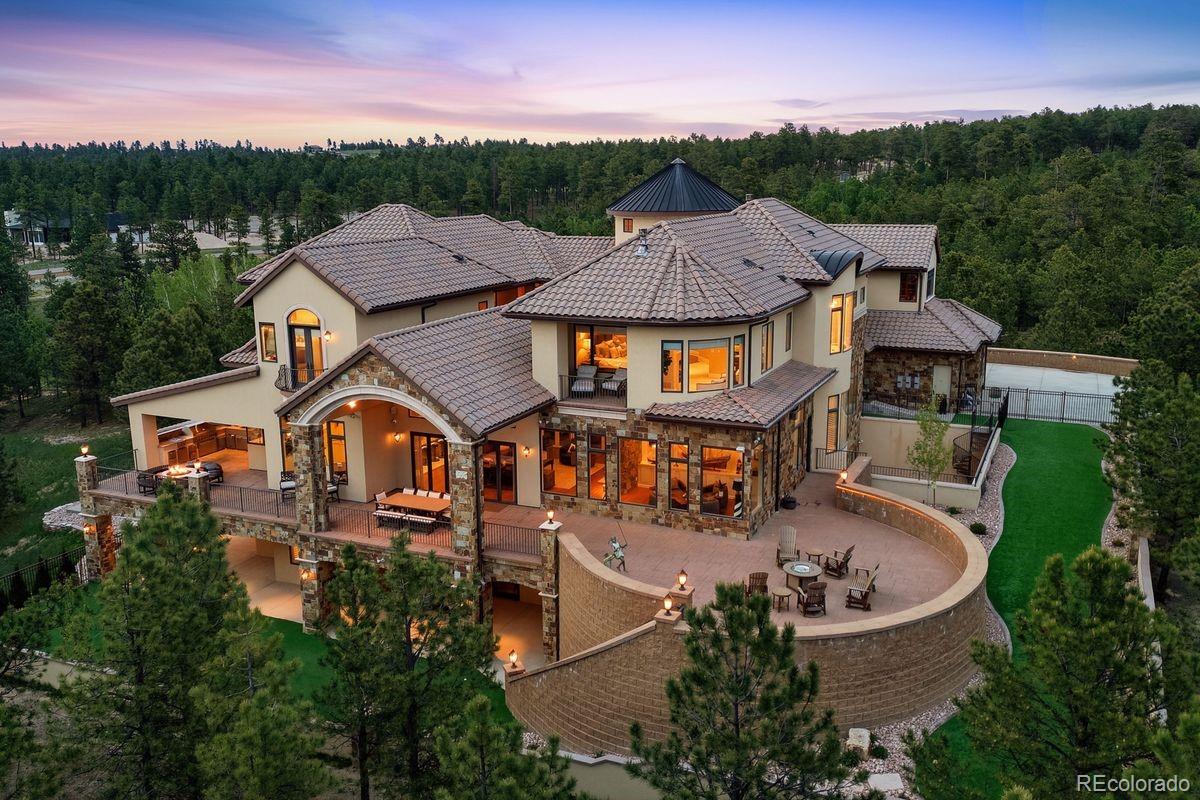
Colorado Springs has a housing market shaped heavily by military presence, regional migration, and varied topography. Property values can differ significantly between Briargate, Northgate, Broadmoor, Fountain, and neighborhoods closer to Fort Carson. Elevation, mountain views, and lot positioning may influence buyer perception of value. Newer master planned communities follow different pricing behavior than older established sections of the city. Proximity to Peterson Space Force Base, Schriever Space Force Base, and the Air Force Academy can impact demand cycles. Single family homes dominate much of the market, though townhomes and newer developments have expanded inventory options. Updated interiors and energy efficient upgrades may strengthen competitive positioning. Access to trails, open space, and outdoor recreation frequently influences buyer decisions. Inventory levels may tighten during peak military transfer seasons. Determining accurate value in Colorado Springs requires analyzing subdivision specific sales rather than relying on citywide averages.
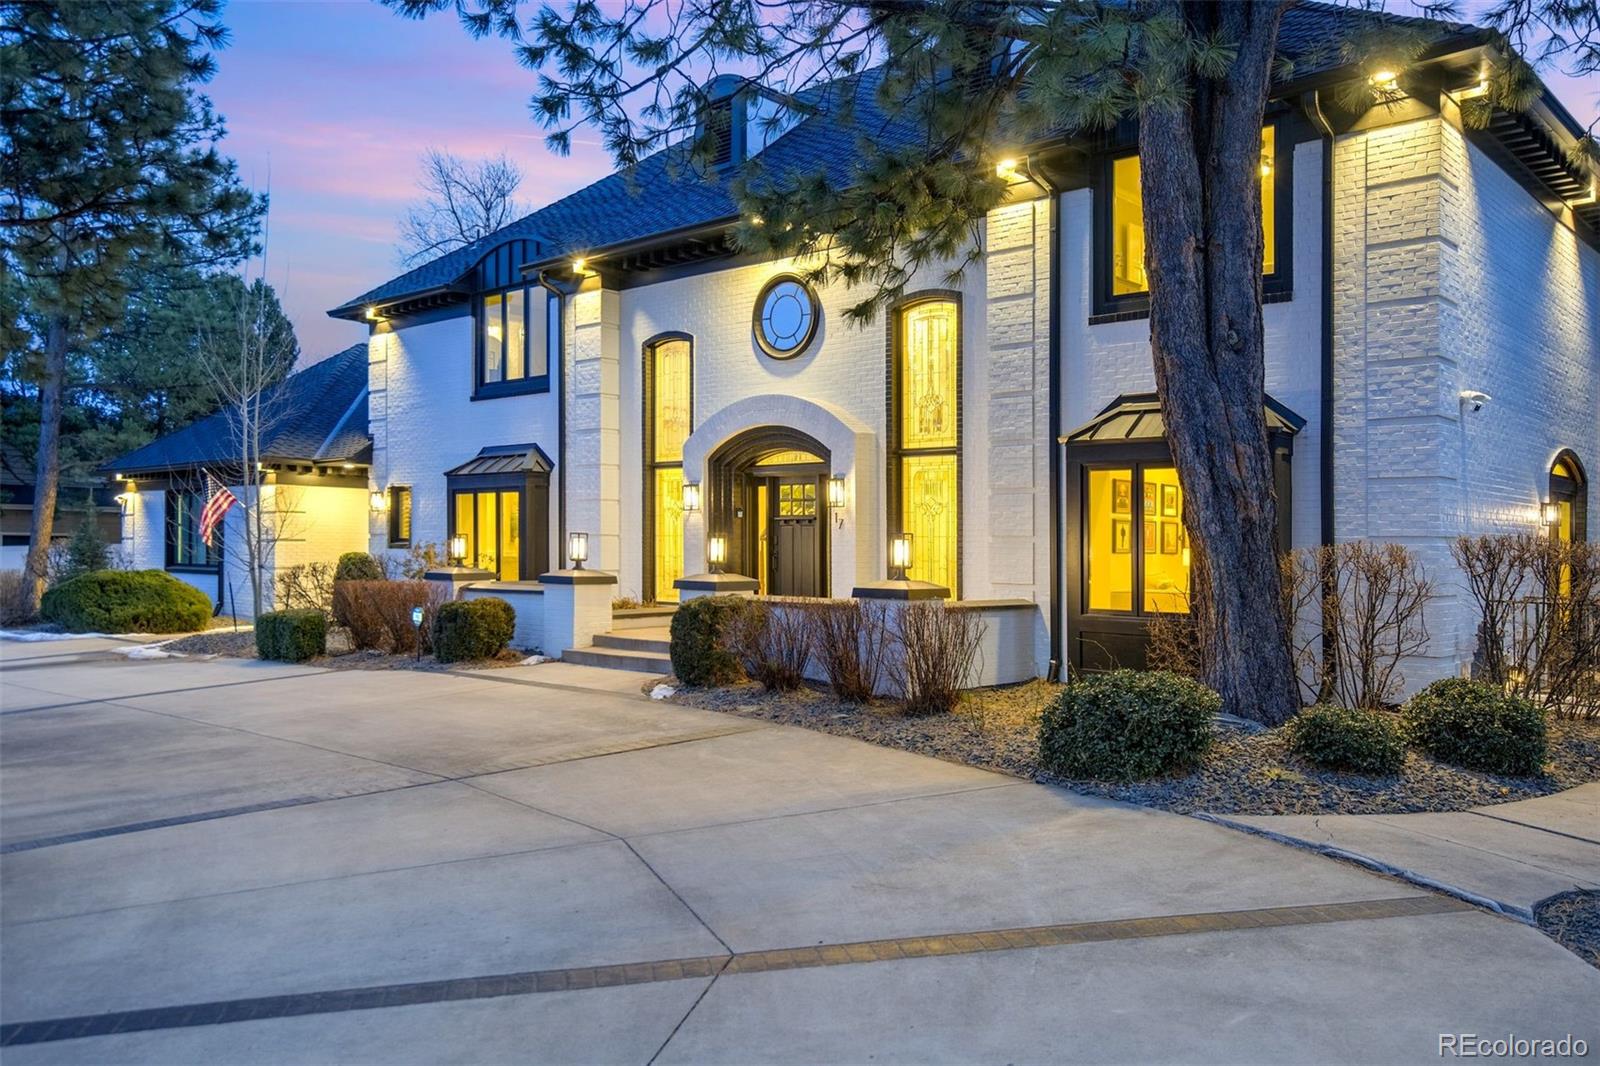
Buyer activity in Colorado Springs often reflects relocation timelines and affordability relative to Denver. Entry and mid range homes may move quickly when priced in line with recent neighborhood performance. Overpricing can reduce showing activity even in strong segments. Homes with modern finishes and open layouts often attract stronger offers than dated properties. Properties located in highly rated school districts may command premium pricing. New construction communities can influence expectations in surrounding areas. Days on market trends help signal whether pricing aligns with demand. Interest rate movement can impact buyer qualification and purchasing power. Well maintained homes typically negotiate from a stronger position. A localized valuation review provides clearer guidance than automated pricing estimates.
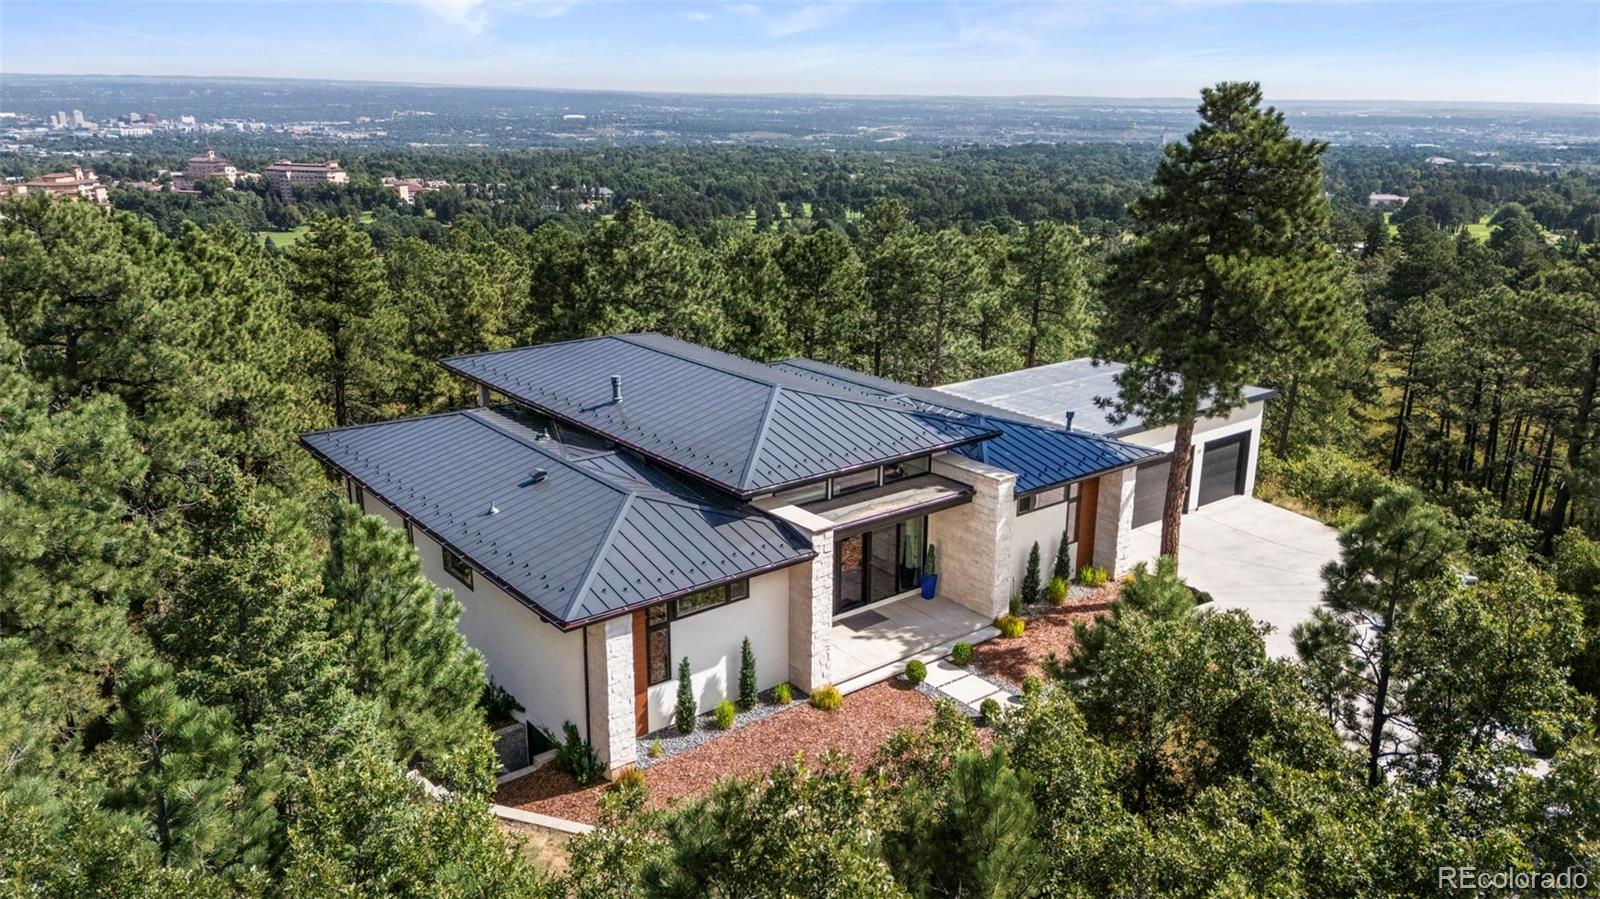
Colorado Springs continues to benefit from steady employment growth and military stability. Buyers relocating from higher cost states often evaluate pricing compared to Front Range alternatives. Infrastructure expansion and residential development may influence long term appreciation patterns. Strategic pricing improves the likelihood of attracting serious buyers efficiently. Micro market differences can exist even within the same master planned community. Market momentum may shift depending on inventory supply and seasonal transfer activity. Proper preparation strengthens overall market positioning. Understanding buyer motivation improves negotiation outcomes. Whether preparing to sell or reviewing equity, accurate valuation methodology is essential. A Colorado Springs focused home pricing analysis grounded in current neighborhood performance provides dependable pricing clarity.
613,448 people live in Colorado Springs, where the median age is 35.8 and the average individual income is $43,826.348. Data provided by the U.S. Census Bureau.
Total Population
Median Age
Population Density Population Density This is the number of people per square mile in a neighborhood.
Average individual Income
There's plenty to do around Colorado Springs, including shopping, dining, nightlife, parks, and more. Data provided by Walk Score and Yelp.
Explore popular things to do in the area, including Somjai Thai Cuisine, and Morning Glory Espresso.
| Name | Category | Distance | Reviews |
Ratings by
Yelp
|
|---|---|---|---|---|
| Dining | 4.59 miles | 52 reviews | 4.7/5 stars | |
| Dining · $ | 4.95 miles | 81 reviews | 4.5/5 stars | |
|
|
||||
|
|
||||
|
|
||||
|
|
||||
|
|
||||
|
|
Colorado Springs has 241,518 households, with an average household size of 73.57. Data provided by the U.S. Census Bureau. Here’s what the people living in Colorado Springs do for work — and how long it takes them to get there. Data provided by the U.S. Census Bureau. 613,448 people call Colorado Springs home. The population density is 2,904.652 and the largest age group is Data provided by the U.S. Census Bureau.
Total Population
Population Density Population Density This is the number of people per square mile in a neighborhood.
Median Age
Men vs Women
Population by Age Group
0-9 Years
10-17 Years
18-24 Years
25-64 Years
65-74 Years
75+ Years
Education Level
Total Households
Average Household Size
Average individual Income
Households with Children
With Children:
Without Children:
Marital Status
Blue vs White Collar Workers
Blue Collar:
White Collar:


Offering clients personalized representation, tailored marketing strategies, and premium service. Consistently surpassing expectations for buyers, sellers, and others.