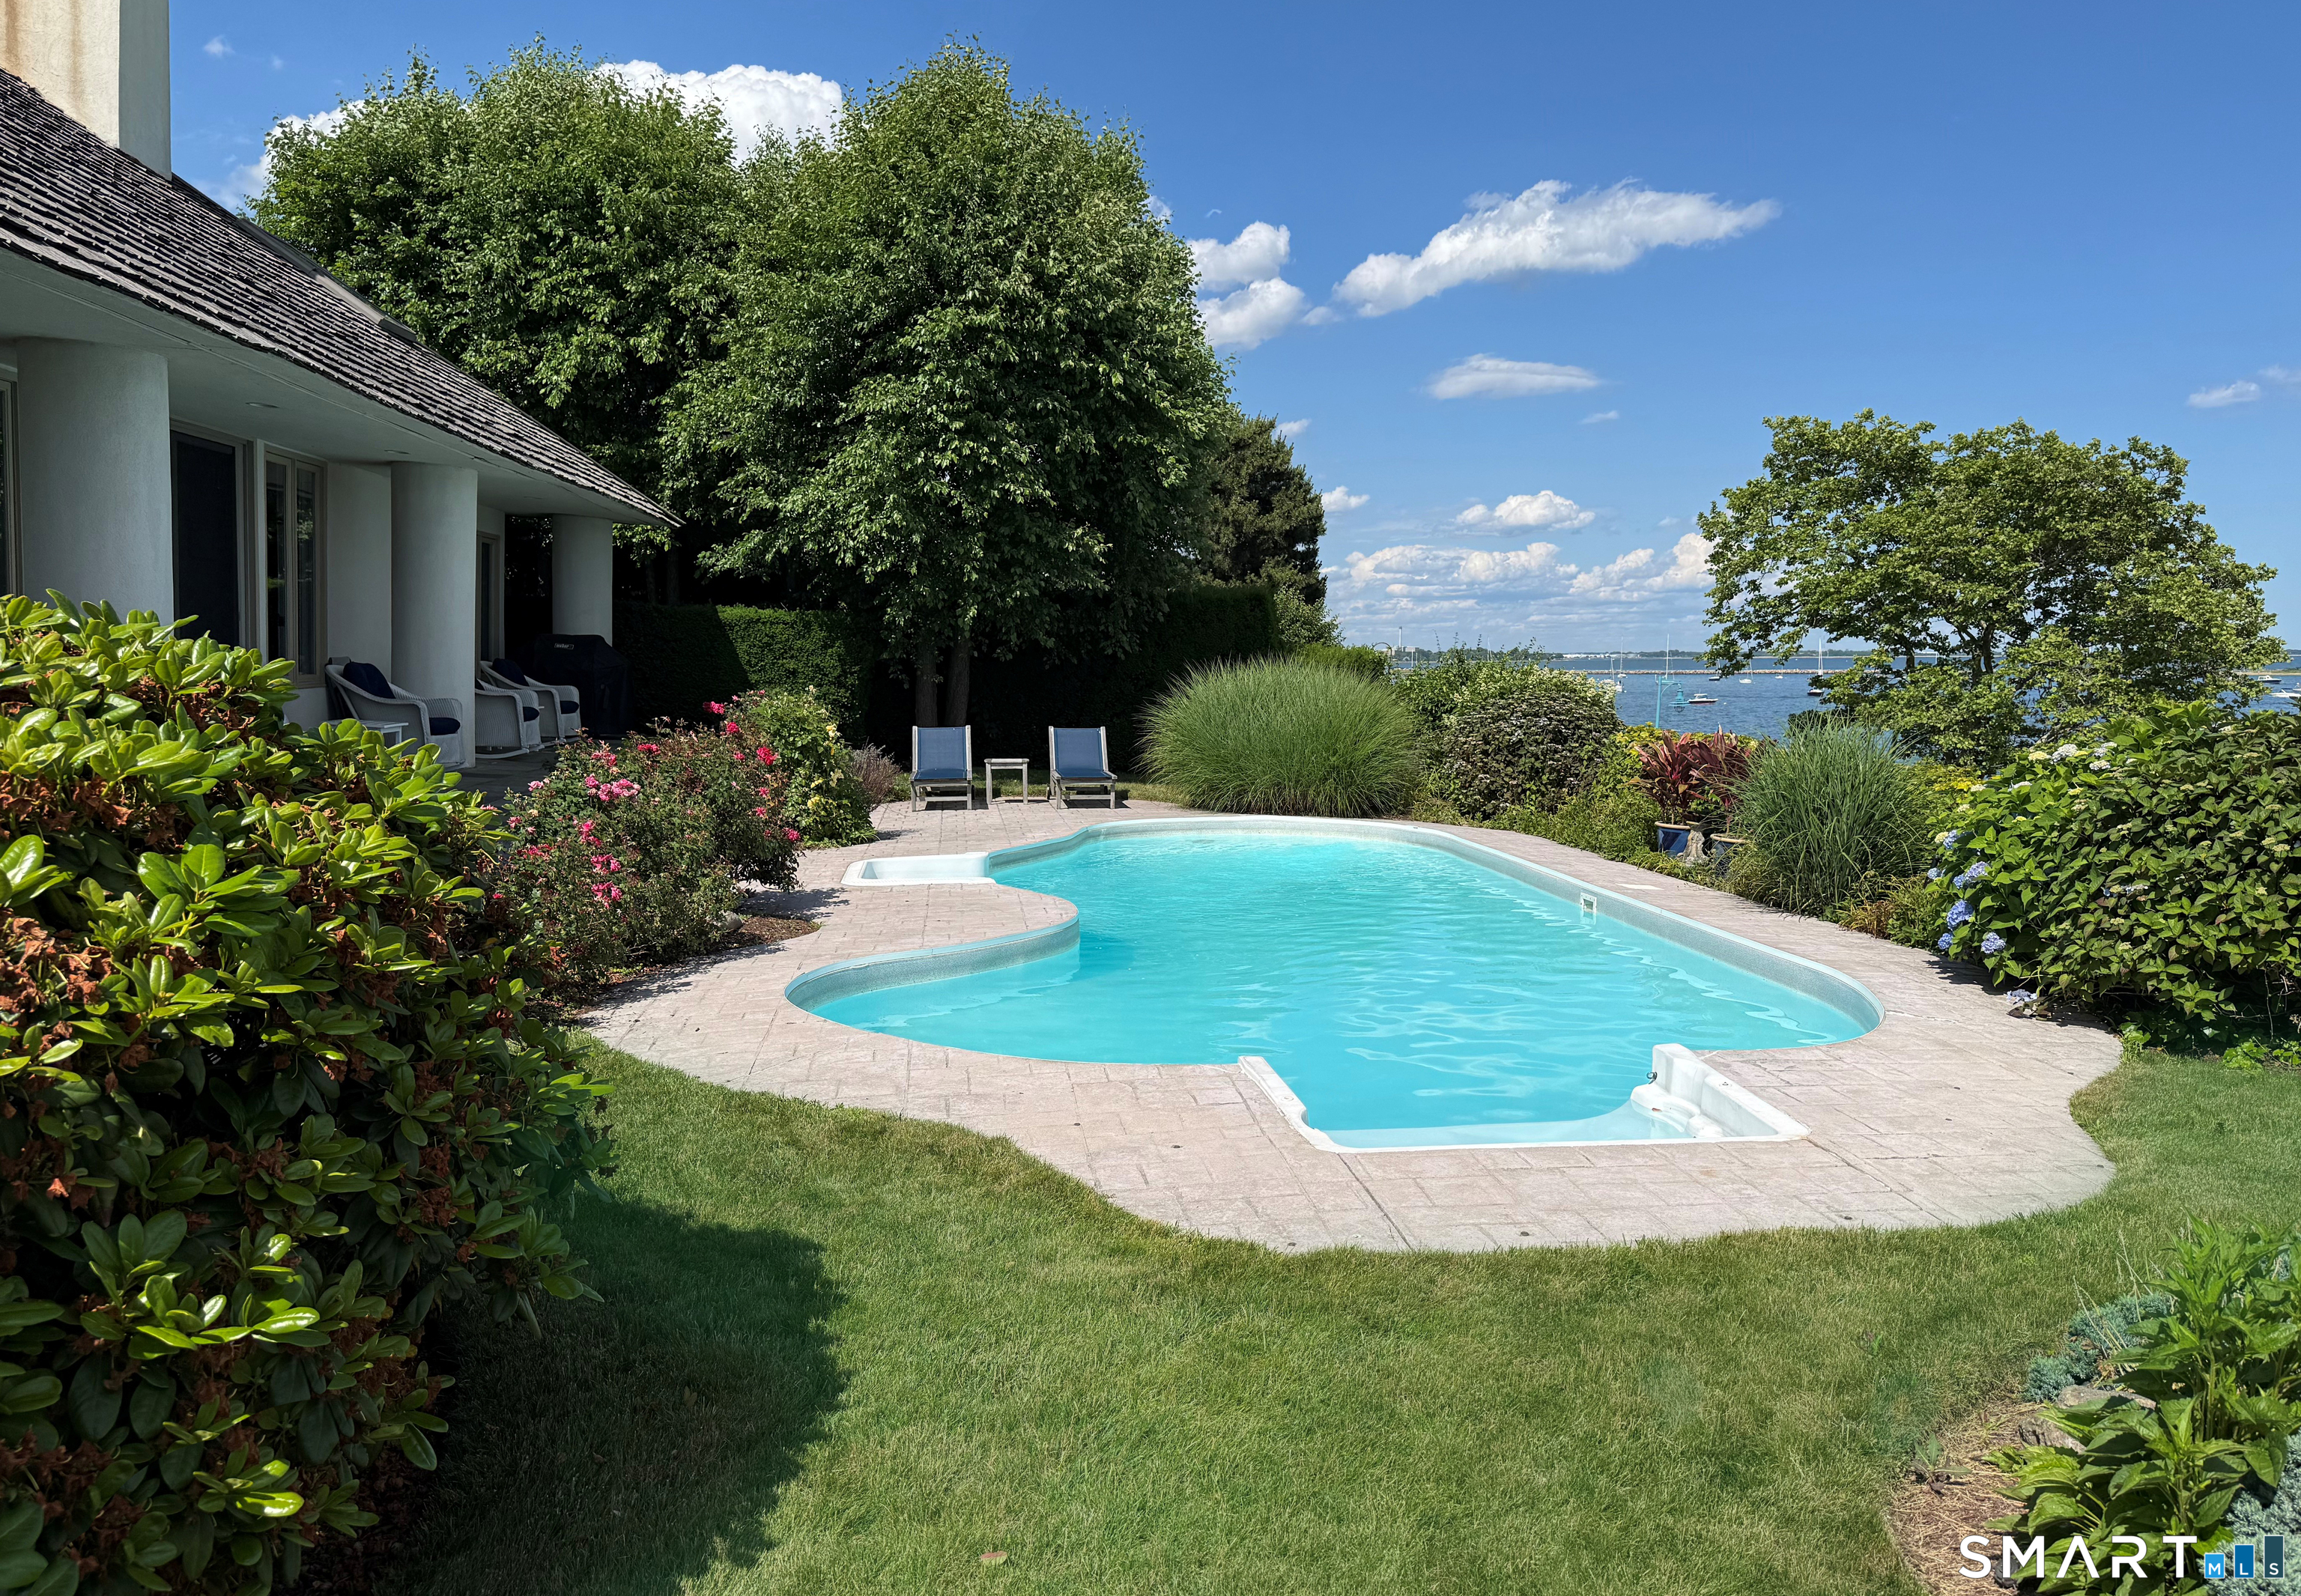
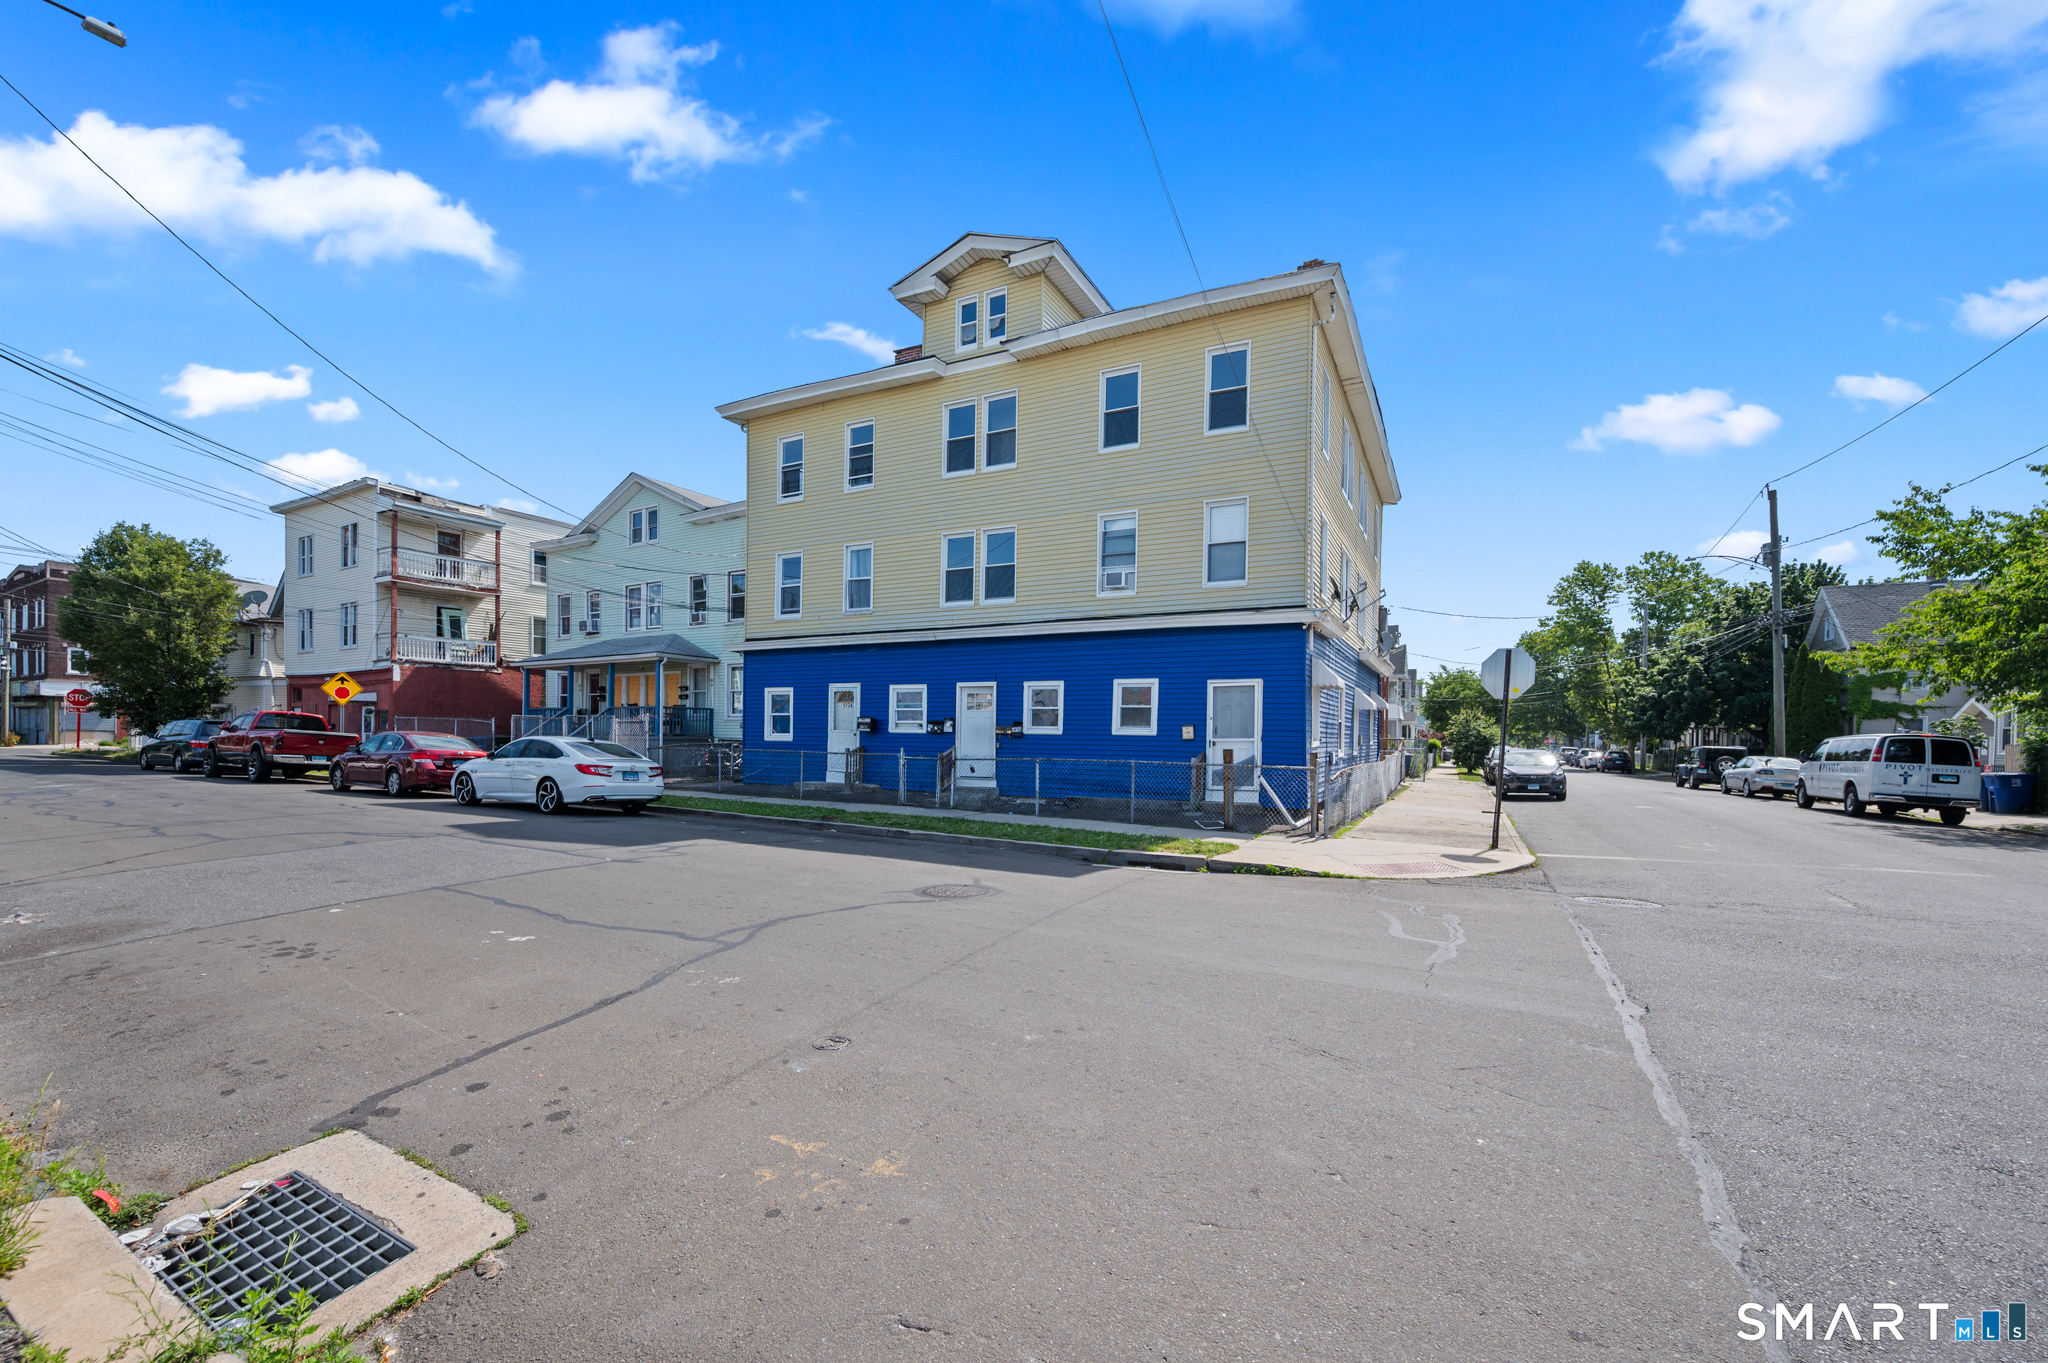
ridgeport’s housing market reflects a mix of coastal location, urban density, and multifamily inventory. Property values can vary significantly between areas such as Black Rock, North End, Brooklawn, and the East Side. Waterfront proximity near Black Rock and St Mary’s by the Sea may influence pricing differently than inland neighborhoods. Two family and three family homes represent a meaningful portion of overall housing activity. Investor participation can impact pricing trends in certain sections of the city. Single family homes typically follow different buyer patterns than income producing properties. Access to I 95 and Metro North rail service can affect commuter demand. Condition and major system updates often carry more weight than cosmetic finishes in pricing decisions. Inventory levels may fluctuate depending on investor activity and entry level buyer demand. Determining accurate value in Bridgeport requires analyzing recent neighborhood specific transactions rather than relying on broader Fairfield County averages.
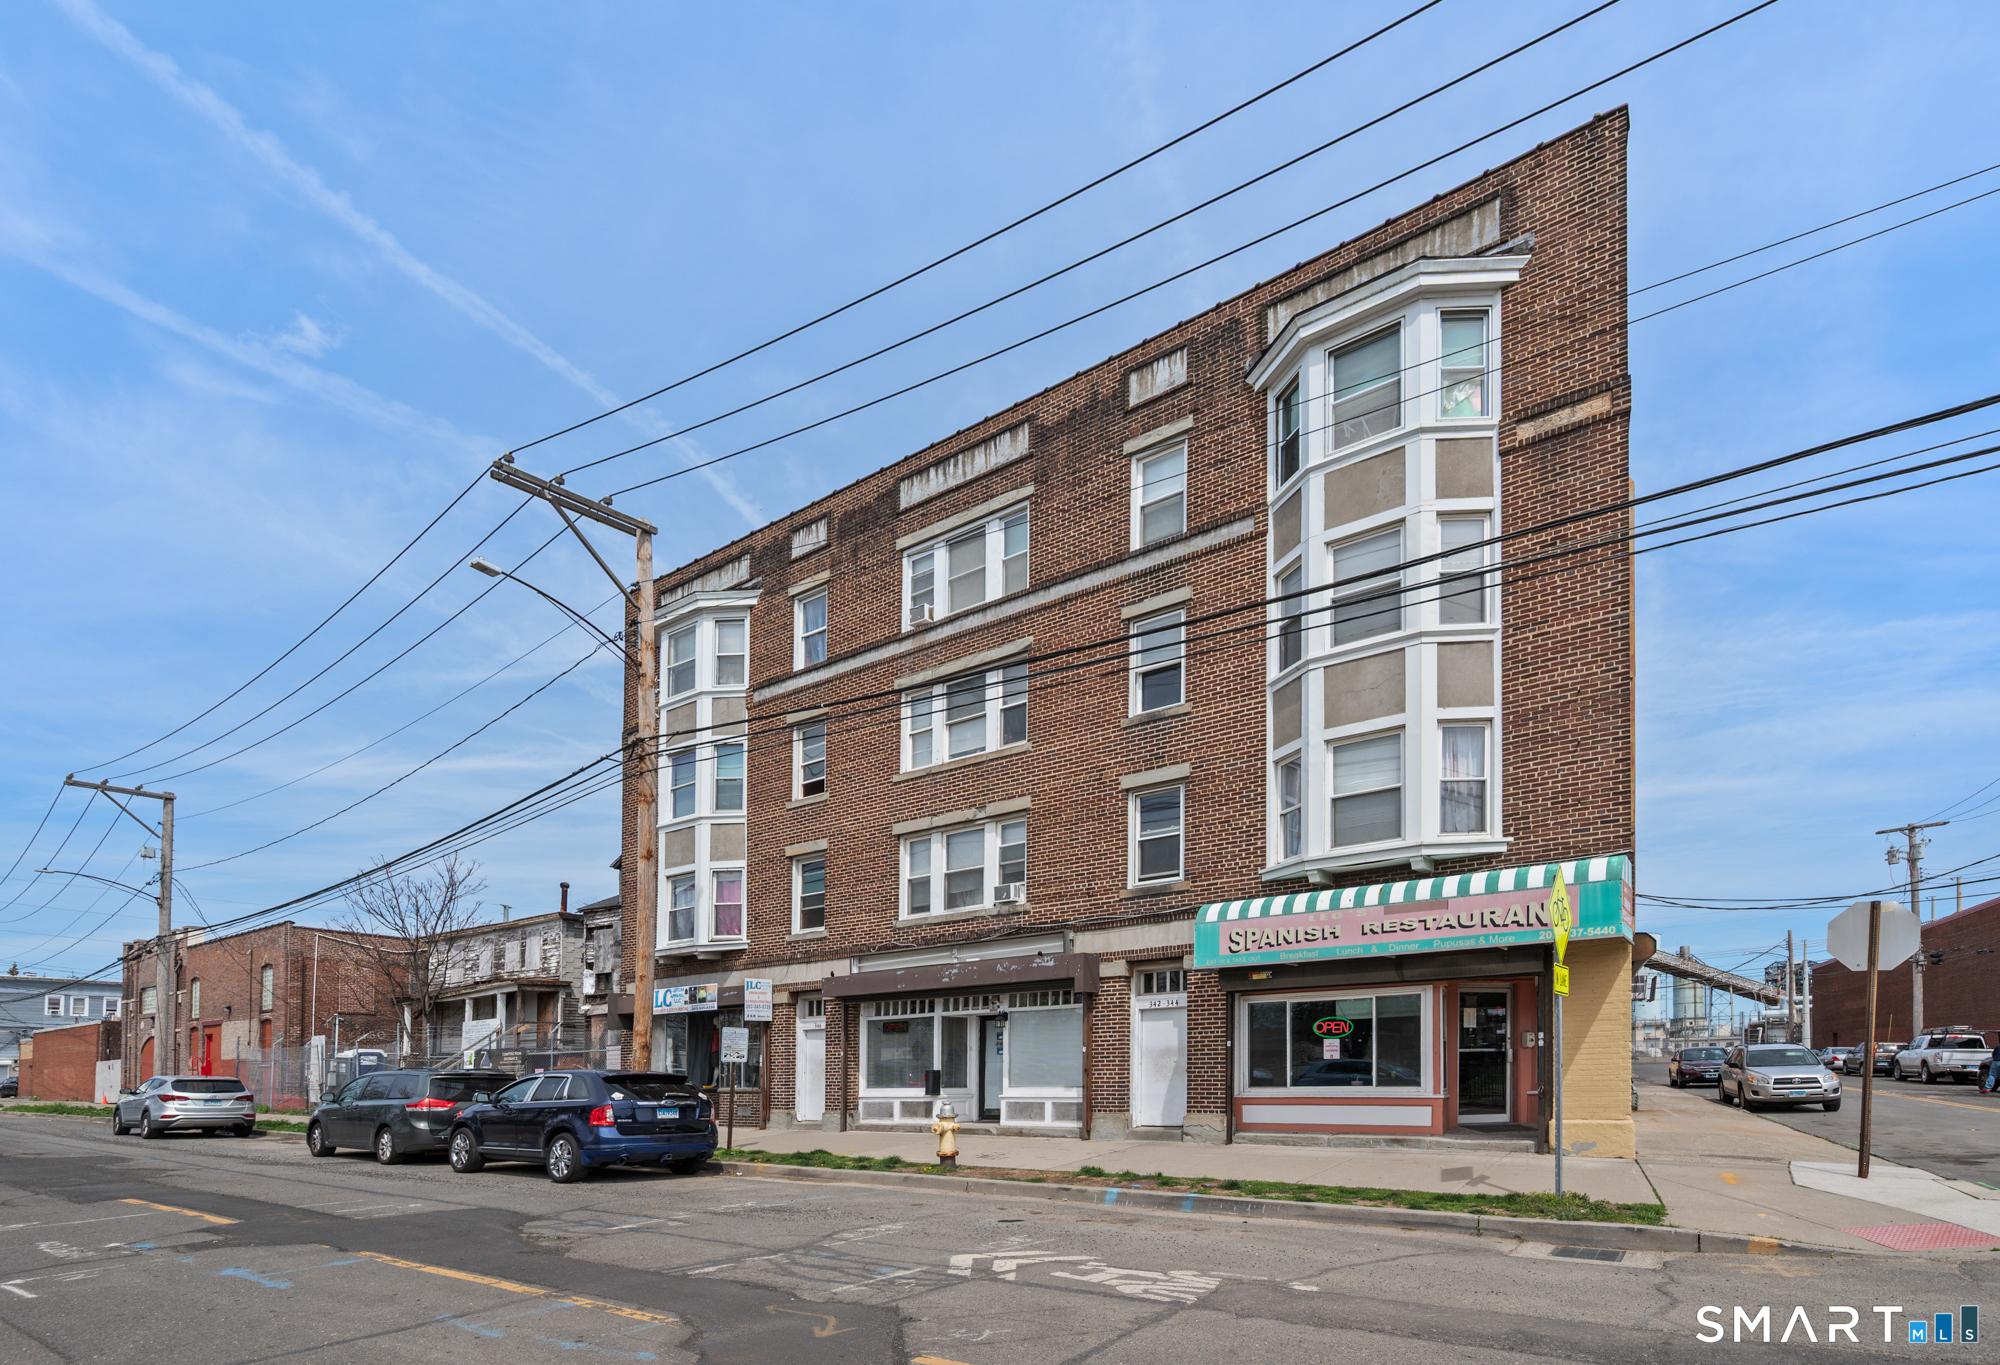
Market performance in Bridgeport can be highly price sensitive, particularly in entry and mid range segments. Buyers often compare properties closely on condition, layout, and repair needs. Properties requiring significant renovation may experience limited showing activity if priced above neighborhood benchmarks. Multifamily homes are frequently evaluated based on rental income stability and occupancy history. Well maintained homes in desirable sections such as the North End may attract stronger offers. Overpricing can quickly lead to extended time on market. Days on market trends often signal whether pricing aligns with buyer expectations. Flood zone considerations may influence valuation in certain coastal sections. Renovation quality frequently creates noticeable differences in final sale price. A localized pricing review provides clearer guidance than generalized state or county data.
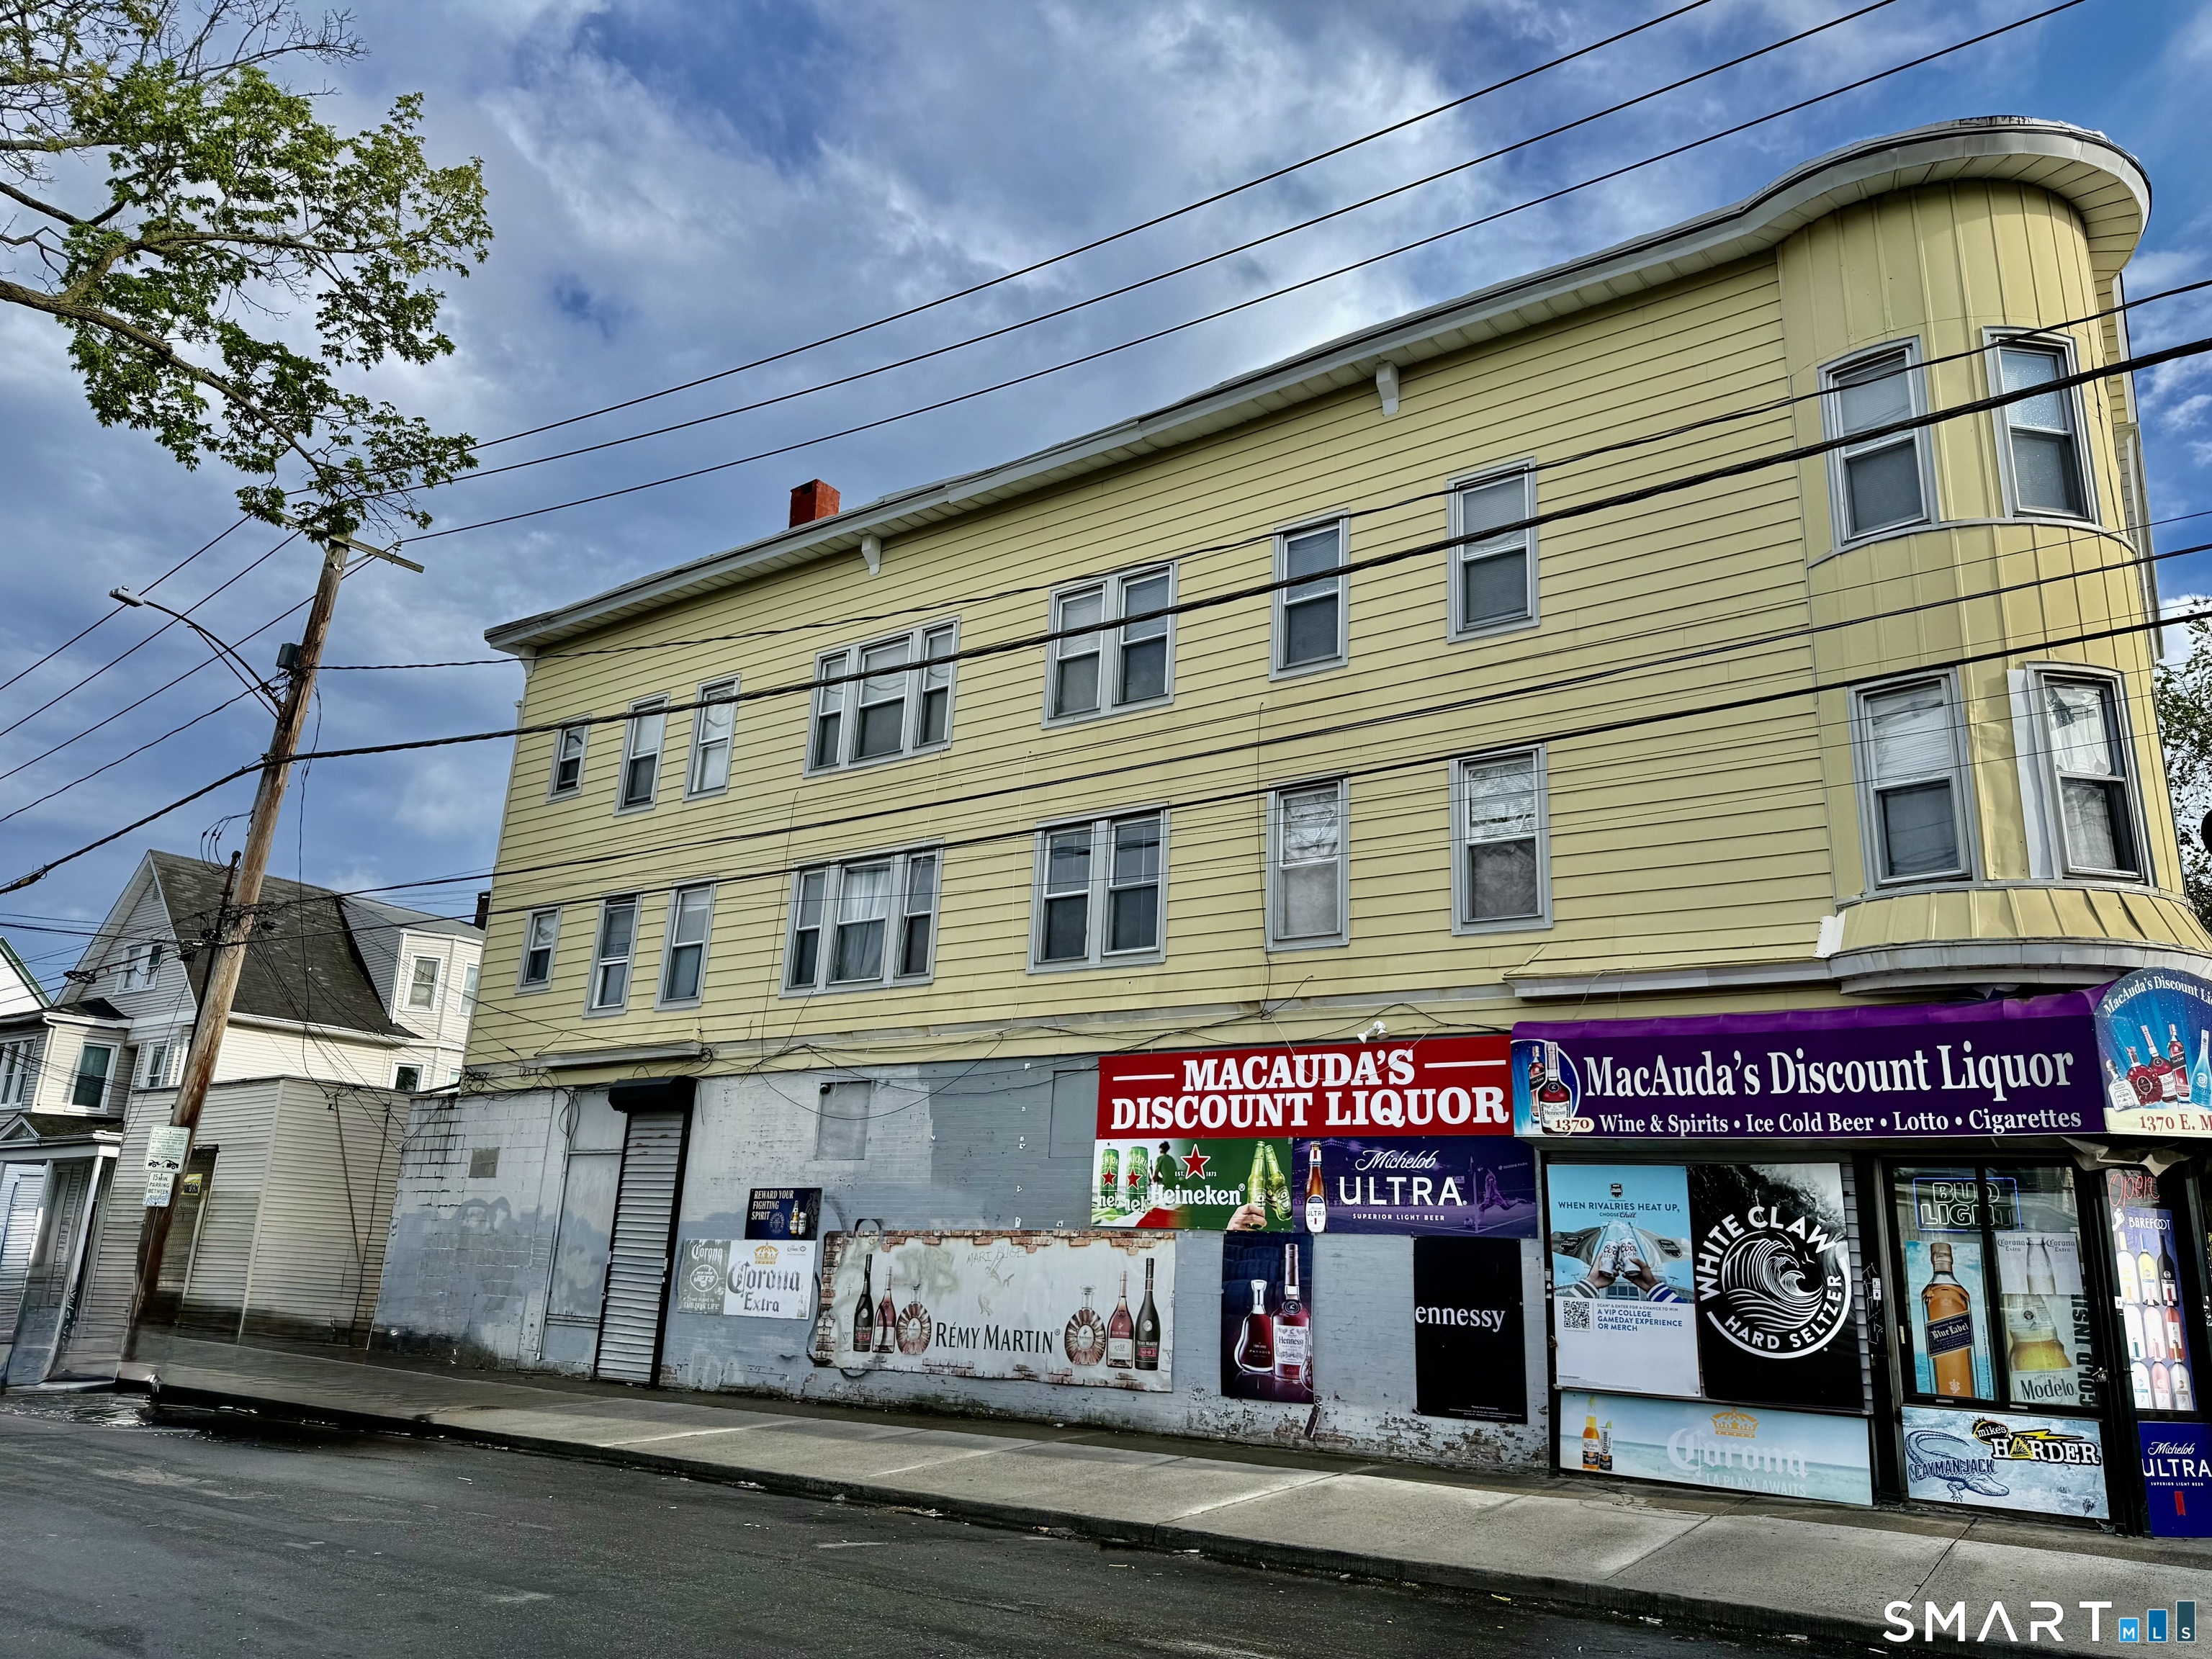
Bridgeport continues to attract both first time buyers and investors seeking relative affordability compared to surrounding coastal towns. Buyers often evaluate value relative to nearby communities such as Fairfield and Stratford. Strategic pricing improves the likelihood of consistent showing activity and competitive offers. Micro market behavior may differ even within short geographic distances. Market conditions can shift depending on rental demand and interest rate movement. Infrastructure projects and redevelopment efforts may influence long term appreciation in select neighborhoods. Sellers benefit from understanding current buyer expectations before entering the market. Proper pricing alignment strengthens negotiation position. Whether preparing to sell or monitoring equity, realistic valuation is essential. A Bridgeport focused market analysis grounded in current neighborhood performance provides a more accurate estimate than automated valuation models.
148,012 people live in Bridgeport, where the median age is 36.4 and the average individual income is $30,658. Data provided by the U.S. Census Bureau.
Total Population
Median Age
Population Density Population Density This is the number of people per square mile in a neighborhood.
Average individual Income
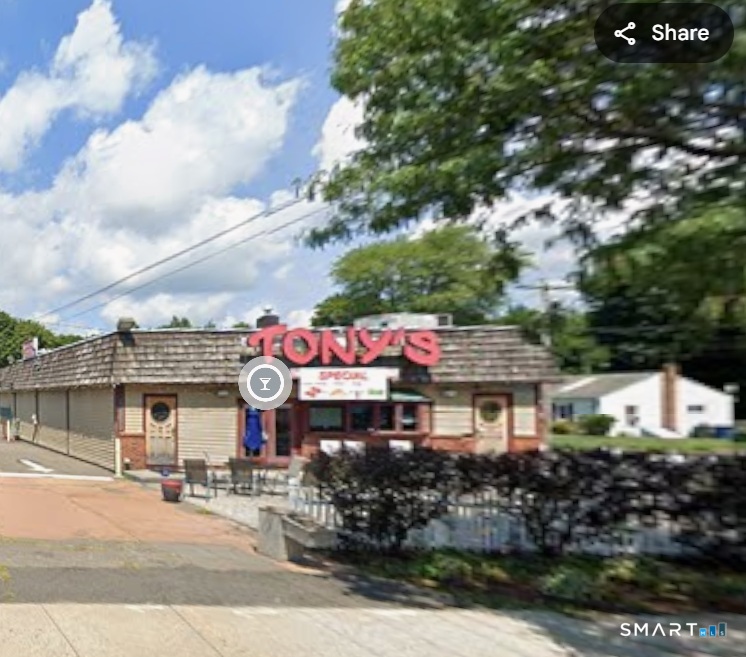
There's plenty to do around Bridgeport, including shopping, dining, nightlife, parks, and more. Data provided by Walk Score and Yelp.
Explore popular things to do in the area, including Jim's Ice Cream Truck, Turnpike Spirit Shop & Wine Emporium, and Ninety 9 Bottles.
| Name | Category | Distance | Reviews |
Ratings by
Yelp
|
|---|---|---|---|---|
| Dining | 3.99 miles | 8 reviews | 5/5 stars | |
| Dining · $$$ | 2.7 miles | 6 reviews | 4.8/5 stars | |
| Dining | 3.71 miles | 10 reviews | 4.8/5 stars | |
| Shopping | 3.7 miles | 5 reviews | 5/5 stars | |
| Active | 3.66 miles | 5 reviews | 5/5 stars | |
| Active | 2.99 miles | 10 reviews | 5/5 stars | |
| Active | 0.93 miles | 7 reviews | 5/5 stars | |
| Active | 4.5 miles | 7 reviews | 4.9/5 stars | |
| Beauty | 1.98 miles | 5 reviews | 5/5 stars | |
| Beauty | 2.75 miles | 16 reviews | 5/5 stars | |
| Beauty | 0.55 miles | 9 reviews | 5/5 stars | |
| Beauty | 0.62 miles | 6 reviews | 5/5 stars | |
| Beauty | 3.35 miles | 5 reviews | 4.8/5 stars | |
|
|
||||
|
|
||||
|
|
||||
|
|
||||
|
|
||||
|
|
Bridgeport has 55,498 households, with an average household size of 2.6. Data provided by the U.S. Census Bureau. Here’s what the people living in Bridgeport do for work — and how long it takes them to get there. Data provided by the U.S. Census Bureau. 148,012 people call Bridgeport home. The population density is 9,213.66 and the largest age group is Data provided by the U.S. Census Bureau.
Total Population
Population Density Population Density This is the number of people per square mile in a neighborhood.
Median Age
Men vs Women
Population by Age Group
0-9 Years
10-17 Years
18-24 Years
25-64 Years
65-74 Years
75+ Years
Education Level
Total Households
Average Household Size
Average individual Income
Households with Children
With Children:
Without Children:
Marital Status
Blue vs White Collar Workers
Blue Collar:
White Collar:

Offering clients personalized representation, tailored marketing strategies, and premium service. Consistently surpassing expectations for buyers, sellers, and others.