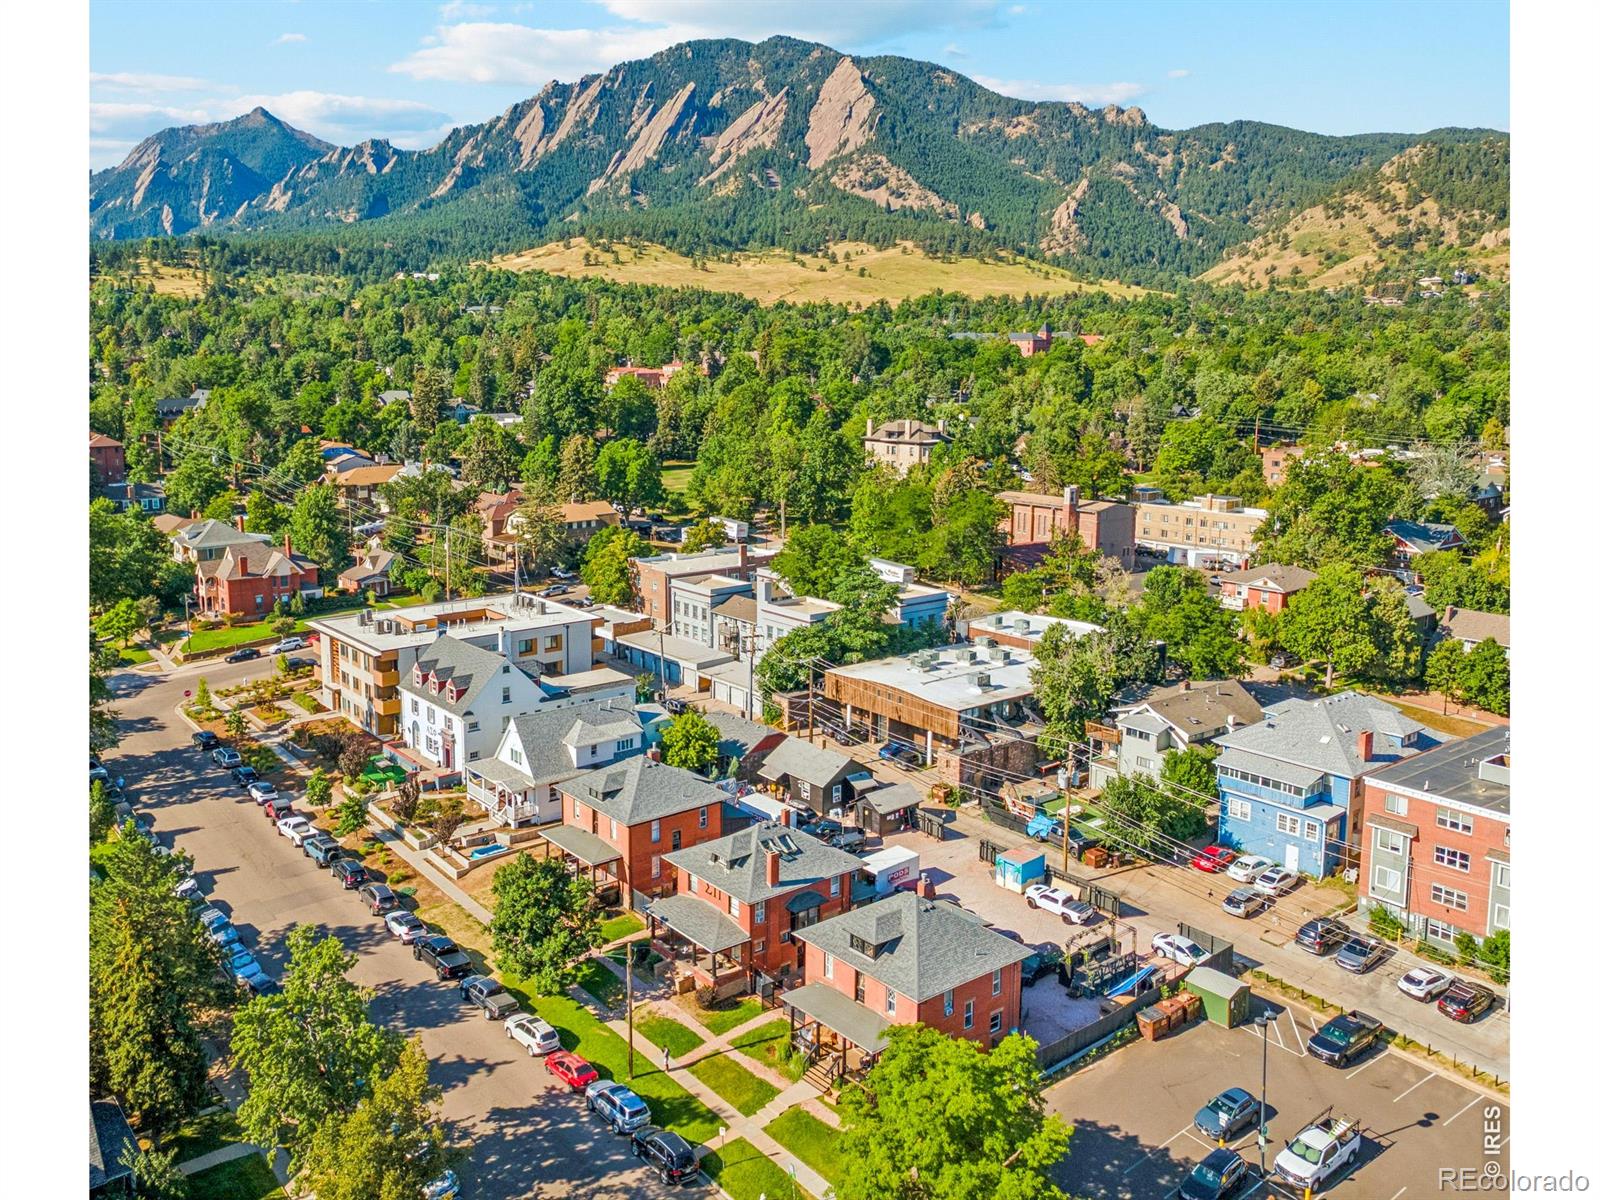
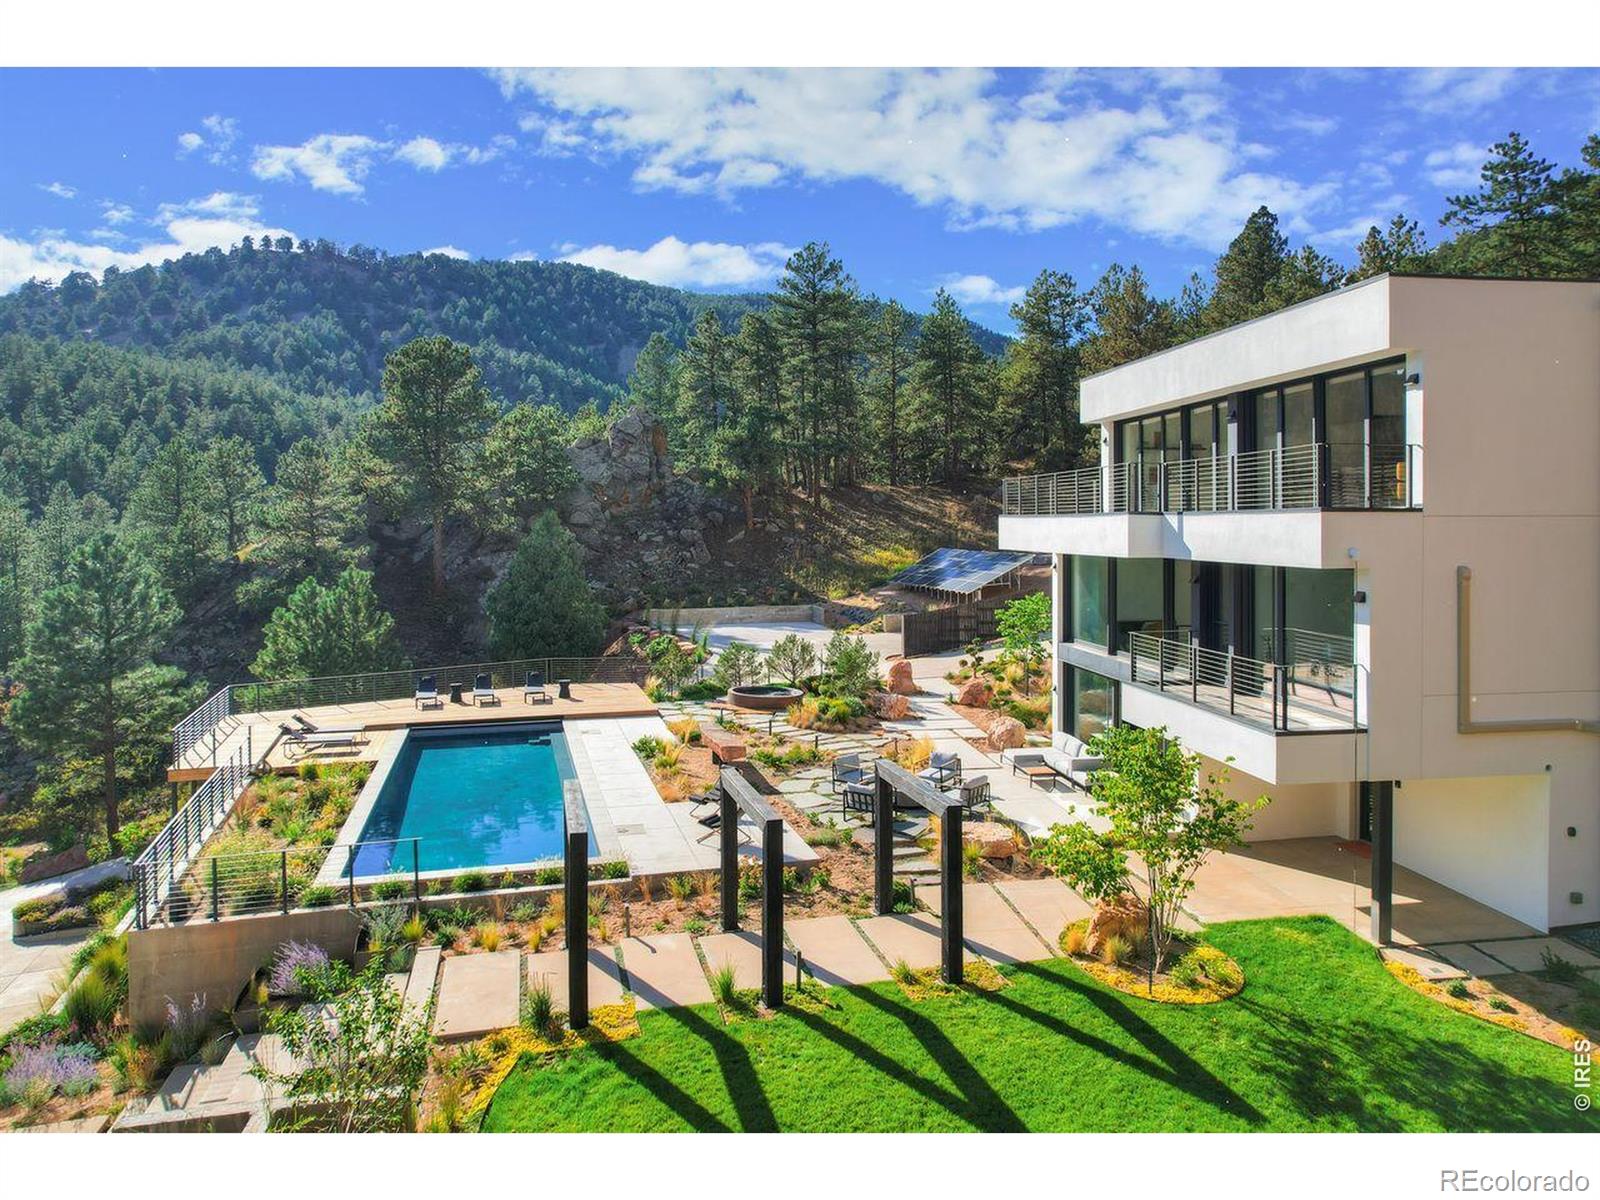
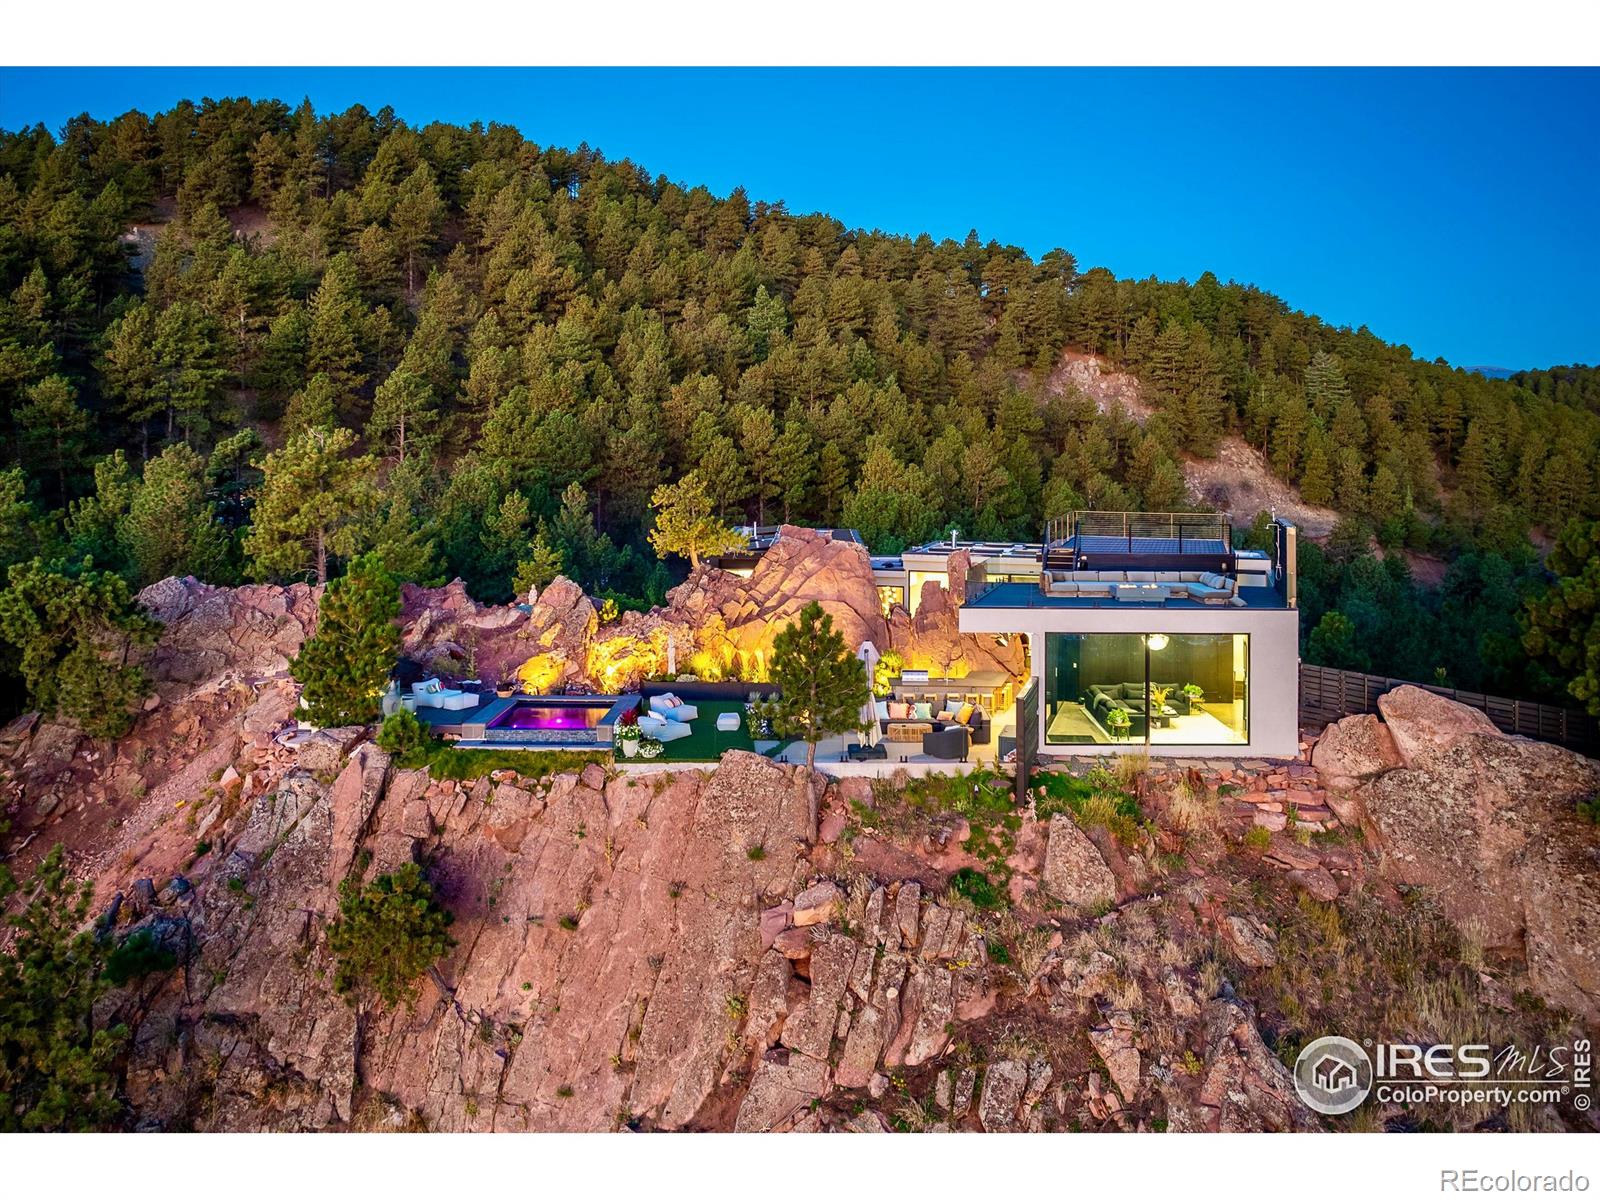
Boulder’s housing market is defined by limited land supply, mountain views, and strong lifestyle driven demand. Property values can vary significantly between Downtown Boulder, Mapleton Hill, Table Mesa, North Boulder, and neighborhoods near CU Boulder. Open space access and proximity to trail systems often influence buyer perception of value. Homes with Flatirons views may command premium pricing compared to similar properties without view corridors. Strict zoning regulations and land use constraints contribute to limited inventory. Renovated interiors, energy efficient upgrades, and modern design frequently increase market appeal. Access to Pearl Street and walkable amenities can strengthen pricing power. Single family homes, townhomes, and high end condominiums follow different valuation behavior. Lot size and privacy may carry additional weight in certain neighborhoods. Determining accurate value in Boulder requires analyzing hyper local sales rather than relying on broader county averages.
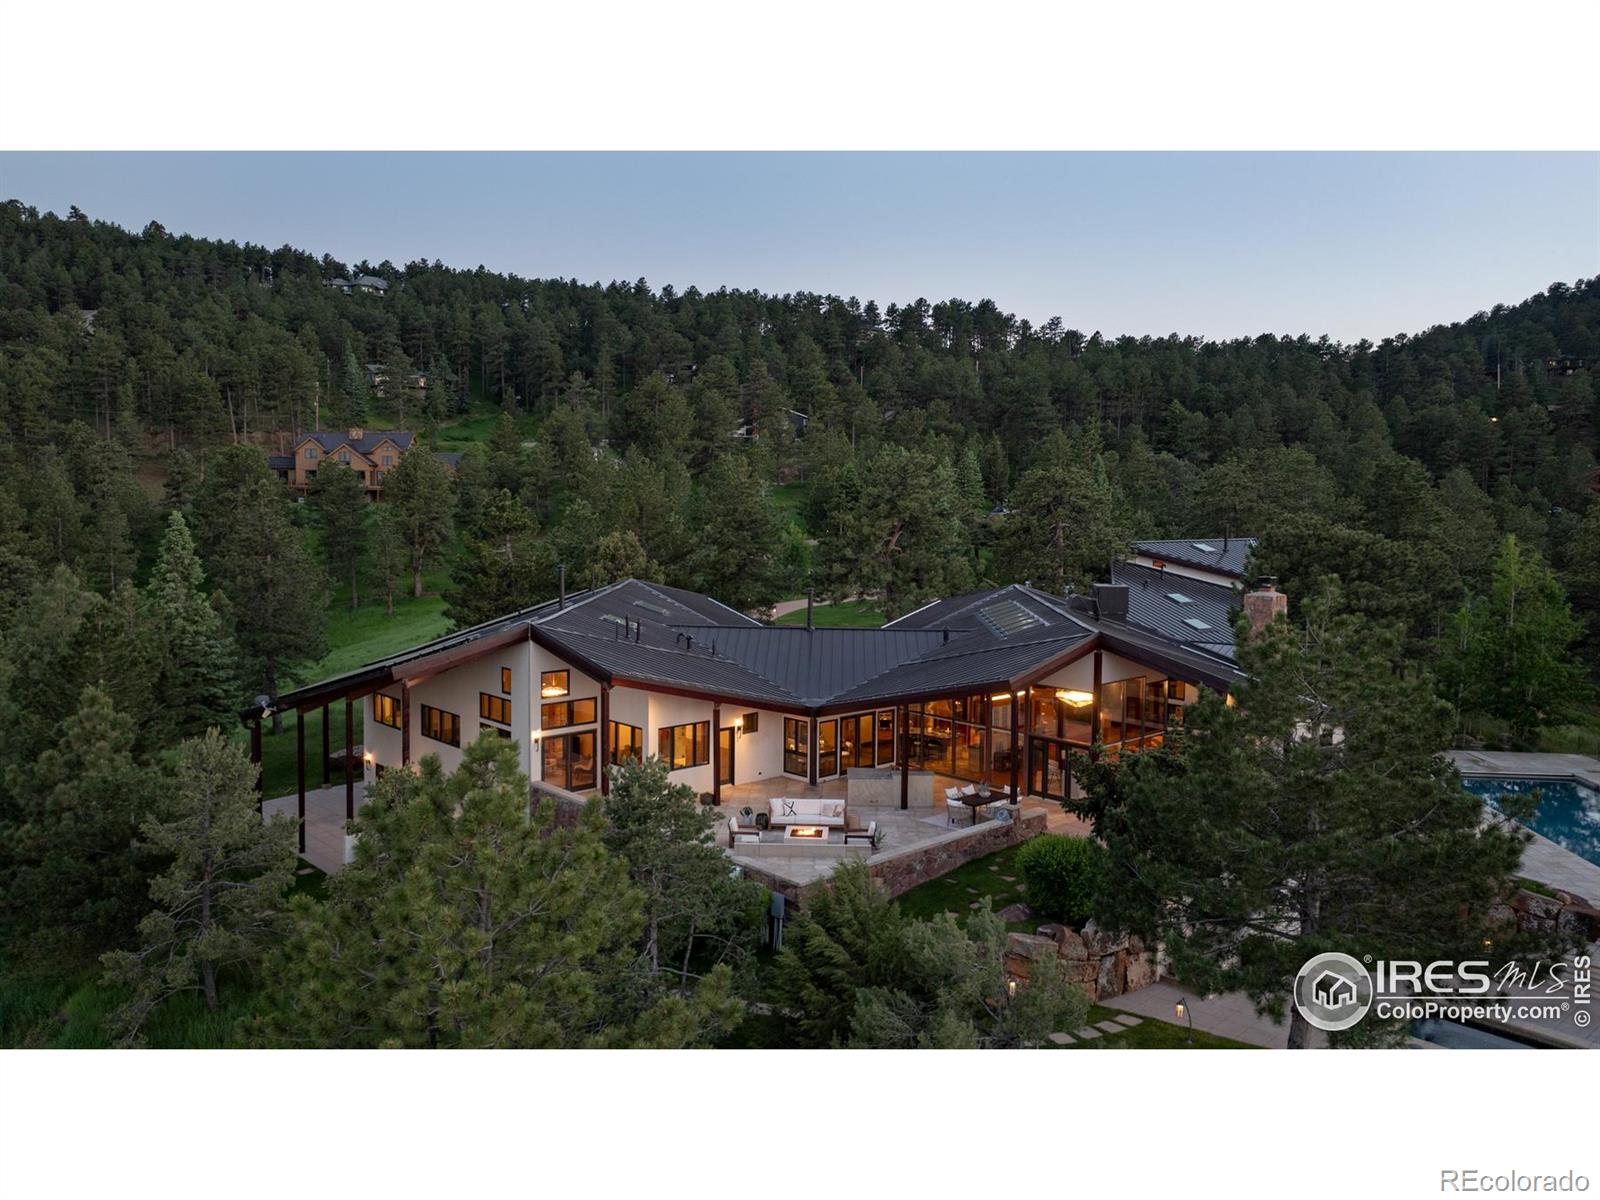
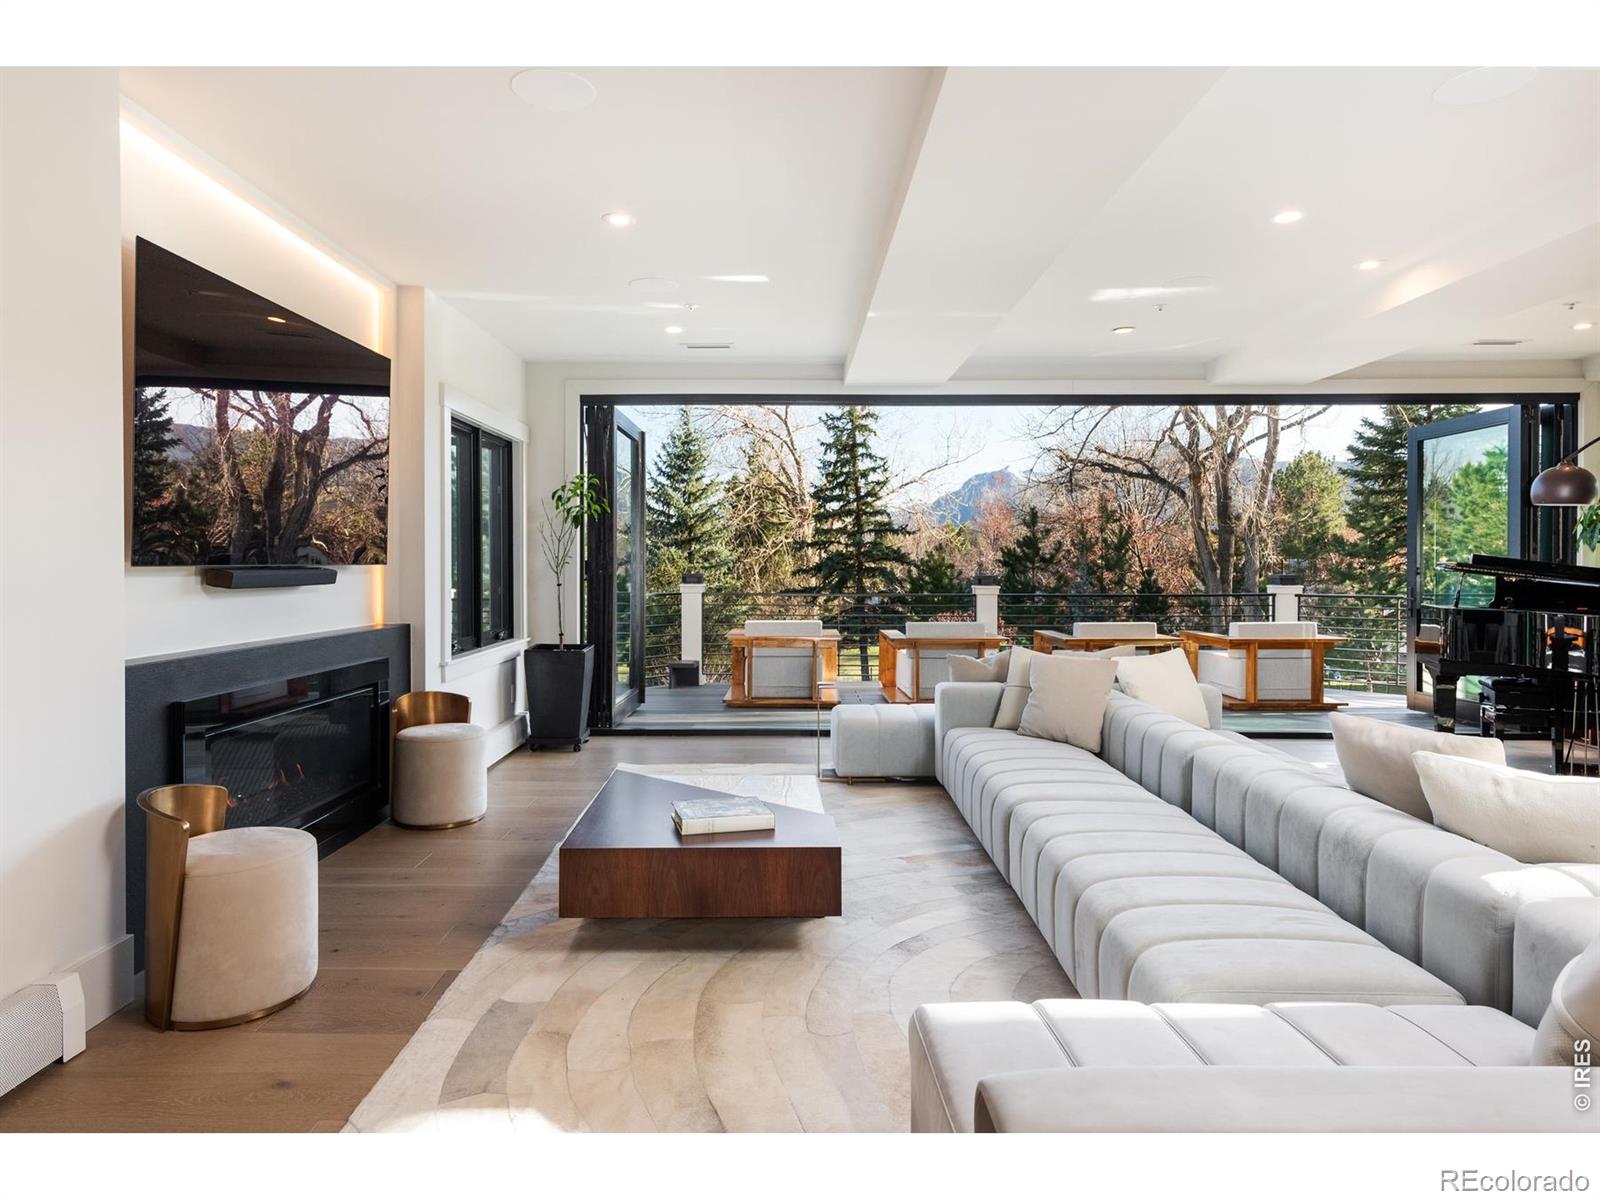
Buyer behavior in Boulder is often influenced by lifestyle priorities and long term appreciation potential. Many buyers compare properties based on outdoor access and neighborhood setting rather than solely on square footage. Homes near CU Boulder may attract both owner occupants and investor interest. Overpricing can lead to extended marketing time even in a supply constrained market. Renovation quality frequently separates competitive listings within the same price tier. Seasonal activity may increase during spring and summer months. Properties requiring major updates may see limited demand relative to move in ready homes. New construction is rare and may reset expectations within specific areas. Days on market trends help signal alignment with buyer appetite. A detailed Boulder pricing review provides clearer insight than automated valuation models.
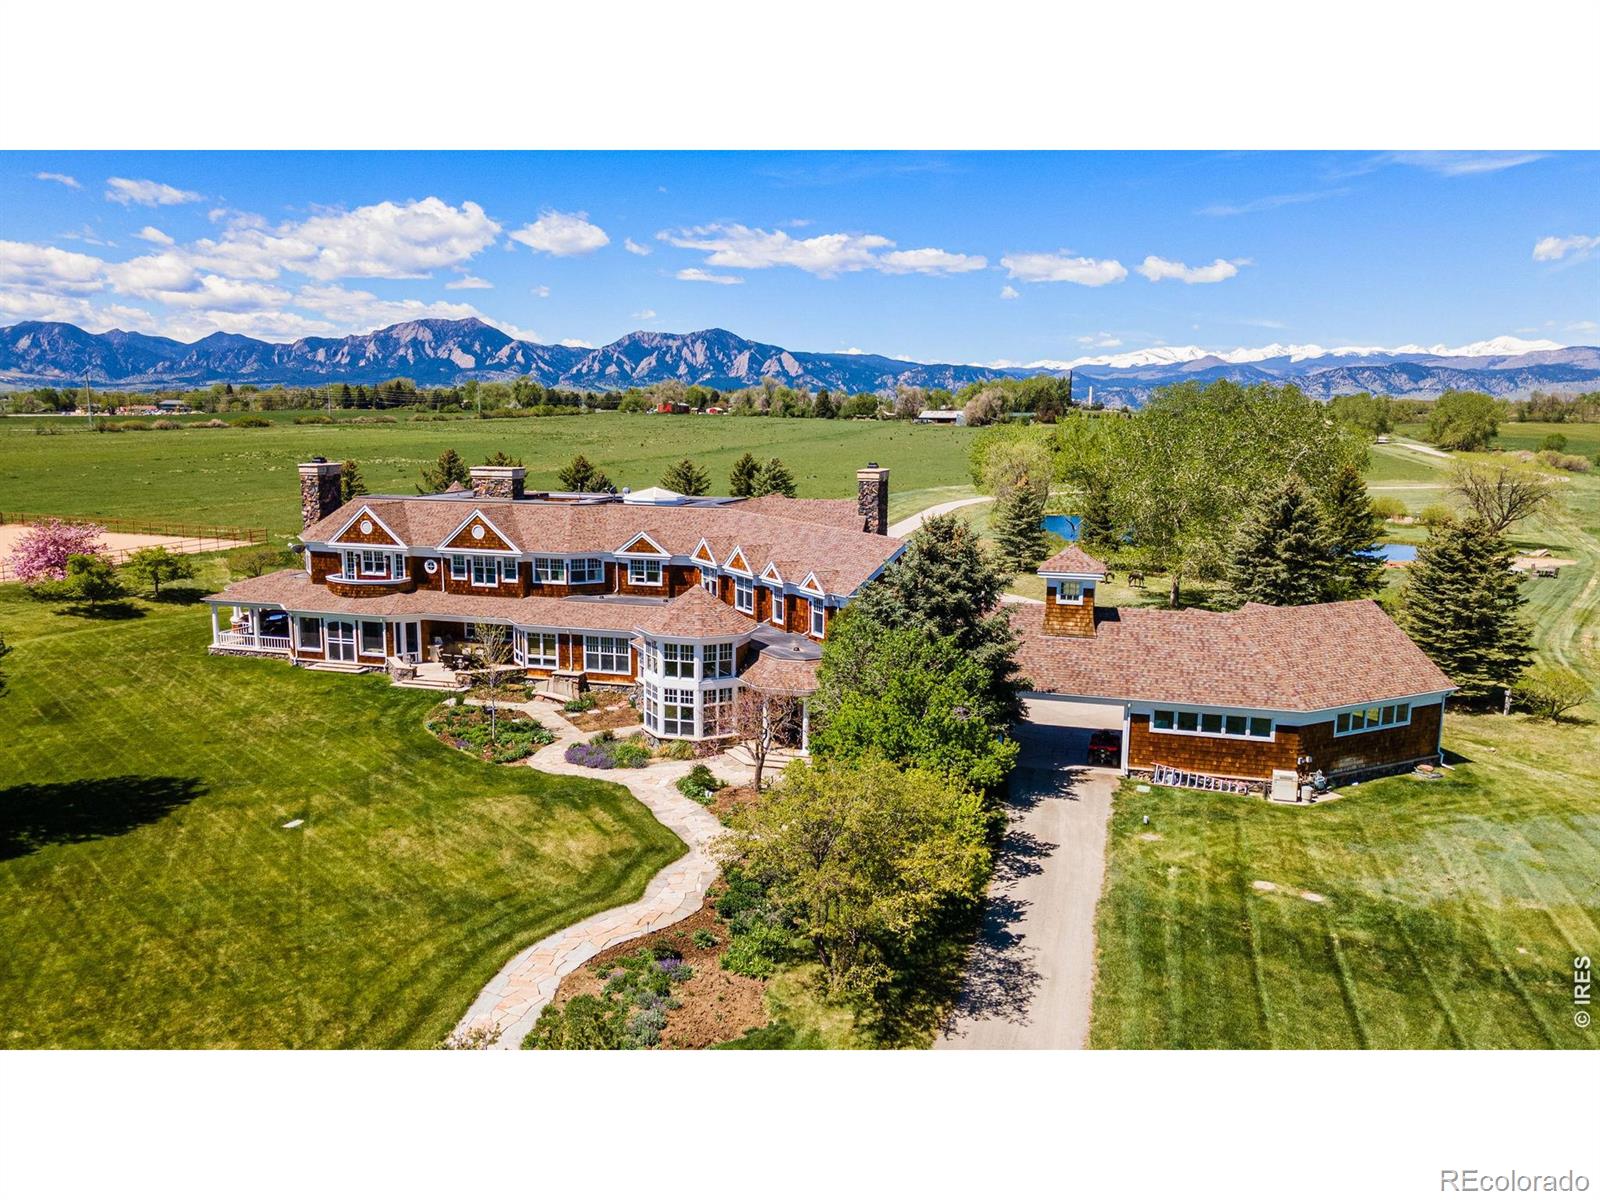
Boulder continues to benefit from tech employment growth, university influence, and migration from higher cost urban markets. Buyers often evaluate Boulder pricing relative to Denver and other Front Range communities. Environmental restrictions and land preservation policies may influence long term supply. Strategic pricing improves the likelihood of strong offers in competitive segments. Micro market differences may exist even between adjacent neighborhoods. Economic conditions and interest rate movement can impact purchasing power. Well positioned homes often move efficiently despite higher price points. Understanding local buyer priorities strengthens negotiation strategy. Whether preparing to sell or evaluating equity, accurate valuation analysis is essential. A Boulder focused home value assessment grounded in current neighborhood performance provides dependable pricing clarity.
129,202 people live in Boulder, where the median age is 32.8 and the average individual income is $62,774.667. Data provided by the U.S. Census Bureau.
Total Population
Median Age
Population Density Population Density This is the number of people per square mile in a neighborhood.
Average individual Income
There's plenty to do around Boulder, including shopping, dining, nightlife, parks, and more. Data provided by Walk Score and Yelp.
Explore popular things to do in the area, including Farm & Smoke, Moksha Chocolate, and Temaki Joint.
| Name | Category | Distance | Reviews |
Ratings by
Yelp
|
|---|---|---|---|---|
| Dining | 1.46 miles | 8 reviews | 5/5 stars | |
| Dining | 3.02 miles | 6 reviews | 5/5 stars | |
| Dining | 3.09 miles | 12 reviews | 5/5 stars | |
| Active | 2.24 miles | 6 reviews | 5/5 stars | |
| Active | 4.33 miles | 7 reviews | 5/5 stars | |
| Active | 3.15 miles | 5 reviews | 5/5 stars | |
| Active | 1.71 miles | 10 reviews | 5/5 stars | |
| Active | 4.33 miles | 10 reviews | 5/5 stars | |
| Active | 2.18 miles | 6 reviews | 4.8/5 stars | |
| Beauty | 2.31 miles | 5 reviews | 5/5 stars | |
| Beauty | 3.73 miles | 5 reviews | 5/5 stars | |
| Beauty | 1.52 miles | 14 reviews | 5/5 stars | |
| Beauty | 4.12 miles | 26 reviews | 4.8/5 stars | |
| Beauty | 2.3 miles | 23 reviews | 4.8/5 stars | |
| Beauty | 2.36 miles | 62 reviews | 4.8/5 stars | |
| Beauty | 1.61 miles | 11 reviews | 4.8/5 stars | |
|
|
||||
|
|
||||
|
|
||||
|
|
||||
|
|
||||
|
|
Boulder has 54,241 households, with an average household size of 10.91. Data provided by the U.S. Census Bureau. Here’s what the people living in Boulder do for work — and how long it takes them to get there. Data provided by the U.S. Census Bureau. 129,202 people call Boulder home. The population density is 2,178.208 and the largest age group is Data provided by the U.S. Census Bureau.
Total Population
Population Density Population Density This is the number of people per square mile in a neighborhood.
Median Age
Men vs Women
Population by Age Group
0-9 Years
10-17 Years
18-24 Years
25-64 Years
65-74 Years
75+ Years
Education Level
Total Households
Average Household Size
Average individual Income
Households with Children
With Children:
Without Children:
Marital Status
Blue vs White Collar Workers
Blue Collar:
White Collar:

Offering clients personalized representation, tailored marketing strategies, and premium service. Consistently surpassing expectations for buyers, sellers, and others.